

AI Predictive Models in Marketing: What Actually Works (And What Quietly Destroys Your Budget)
The industry has spent two years selling you accuracy metrics. The metric that determines whether a predictive model earns its license fee is something almost no vendor dashboard shows you: confidence calibration. Here’s how to read it — and when the honest answer is “don’t deploy.”
Pull up any AI marketing vendor’s homepage and count how many times the word “accuracy” appears. Then count “calibration.” The first number will be in the double digits. The second will be zero.
That asymmetry is costing marketing teams real money — and not in ways that show up cleanly in the post-campaign report.
Here is the phenomenon that almost no Tier A competitor article names directly: a predictive model can be technically accurate on its training set and still generate net-negative ROI in production, not because it’s wrong about who will respond, but because it treats customers who were already going to buy as high-value targets. It runs its discount playbook on people who didn’t need a discount to convert. The conversion happens. The incrementality — the actual causal lift — evaporates. A 2025 Berkeley California Management Review analysis of real-world campaigns found that even technically correct uplift models yield negative outcomes “in some situations” when applied without accounting for the difference between who will respond and who will respond because of the campaign.
That’s the structural moat competitors don’t cross: this article is built around the decision of when not to deploy a predictive model — a framework no vendor writes, because no vendor benefits from you deploying less.
“A model that perfectly predicts who will buy is worthless if most of them were going to buy anyway. Accuracy and incrementality are not the same claim.”
What Changed in 2025: Accountability Replaced Adoption
By 2025, predictive analytics was no longer experimental in most large B2B organizations. A January 2026 analysis from Marrina Decisions — drawn from practitioner interviews across marketing ops, RevOps, and post-sale teams — put it precisely: “What changed in 2025 was not adoption — it was accountability.” Models that had been reporting enhancements became decision drivers: which accounts sales contacted, how budget was allocated, how pipeline was forecast. When predictions were wrong, the cost was no longer a dashboard anomaly. Conversion quality dropped. Sales trust eroded.
The same analysis found that the most successful use cases shared one trait: models that supported prioritization and planning, not autonomous decision-making. The failures clustered around organizations that took probabilistic signals — which is all any model produces — and treated them as deterministic verdicts.
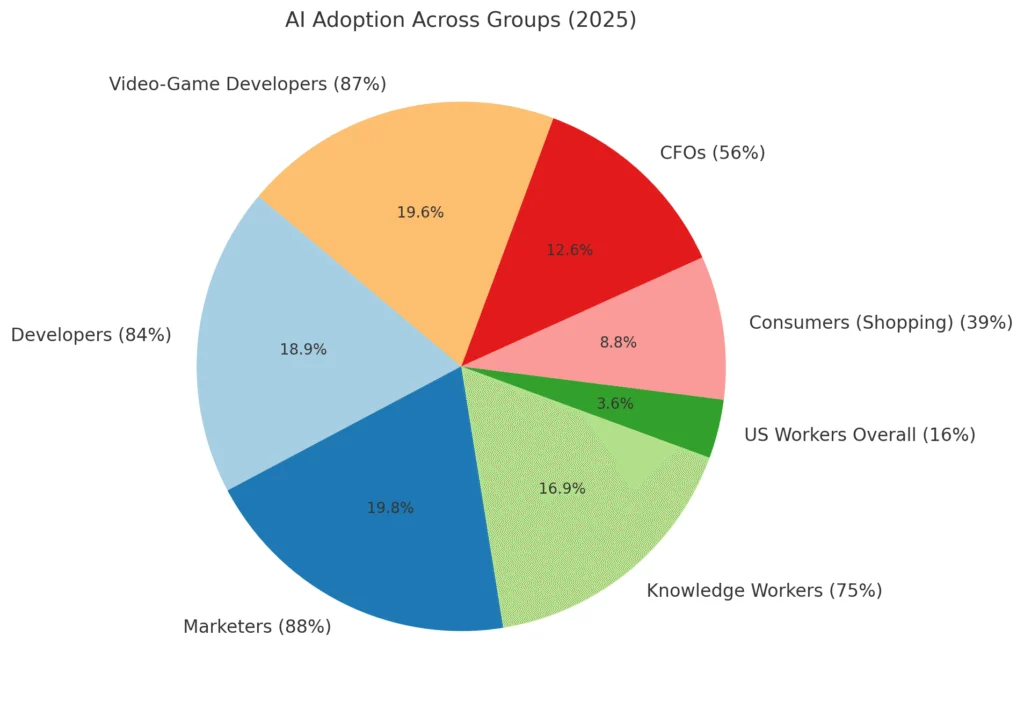
Meanwhile, the failure taxonomy from the vendor side is different but equally telling. A September 2025 compilation from Amra & Elma aggregating McKinsey, HubSpot, and Marketing AI Institute data found that among the 88% of marketers using AI daily, the top failure factors were knowledge gaps (71.7%), technical challenges (70%), and lack of training (67%). The MIT-cited finding in that report landed hardest: most generative AI pilot programs “don’t reach meaningful profitability or impact on the balance sheet.” Companies rushed into testing without anchoring AI to real business needs. Impressive demos that never scaled.
There’s your why-now answer that the original article didn’t provide: adoption is saturated, accountability is arriving, and the gap between “we deployed a model” and “the model earned its cost” is where practitioners will live for the next three years.
The Seven Model Types, Ranked by Deployment Risk
The original article promised seven AI predictive models and delivered none — it listed tools, not model architectures. Here is the actual taxonomy, with deployment-risk context the vendor documentation won’t give you.
Two conceptual points first. Every model below predicts one of two things: response likelihood (will this person buy?) or incremental lift (will this person buy because of our campaign?). These look identical on a dashboard. They are not identical in a P&L. Uplift modelling, the methodology that distinguishes them, has existed in marketing literature since Radcliffe and Surry’s early work in the 1990s. Most teams still aren’t using it.
| Model Type | Predicts | Deployment Risk Level | Primary Failure Mode | Best Audience |
|---|---|---|---|---|
| Uplift / Incremental | Causal lift — who responds because of treatment | Medium (with RCT data) High (without it) |
Requires randomized control group; most orgs lack one | E-commerce, retention teams with large transaction history |
| Propensity / Response | Response likelihood | Medium–High | Captures “sure thing” buyers; overspends discount budget on non-incrementals | Lead prioritization, MQL scoring — as a filter, not a targeting engine |
| Churn / Retention | Probability of lapsing before renewal | Low–Medium | Post-sale data is more stable; risk is false positives triggering unnecessary discounts | SaaS, subscription media, telecom — the most reliable category |
| Lead Scoring (ML) | Purchase readiness composite | Medium | Scores treated as intent signals when they measure engagement, not intent | B2B SDR prioritization; fails when data quality in the CRM is low |
| Media Mix Modelling | Channel contribution to revenue | Low (for planning) High (for reallocation) |
Collinearity in channel data; models trained on prior mix can’t predict outside that range | Budget planning and scenario analysis — not real-time bidding |
| CLV / LTV Prediction | Projected lifetime revenue per customer | Medium | New customer LTV extrapolated from established customer behavior; cohort drift ignored | Acquisition budget setting, loyalty program design |
| Next-Best-Action (NBA) | Optimal next offer or message per customer | High | Requires real-time data pipeline, fresh features, and model retraining cadence most orgs can’t maintain | Retail and financial services at scale — wrong fit for teams below ~500K active customers |
What the table doesn’t tell you
Churn prediction consistently outperforms propensity scoring in measured incremental value. The reason is structural, not technical: churn models operate on first-party product-usage data with a clear outcome variable (renewal/lapse) and a natural intervention window. Propensity models for acquisition operate on behavioral signals that are noisier, richer in “sure thing” buyers, and harder to tie to a causal campaign effect. A February 2026 Coupler.io review of AI marketing use cases cited studies showing churn prediction implementations produce 13–31% churn reduction and 9–20% conversion improvement when teams intervene early — ranges that are directional, not guaranteed, and depend heavily on intervention quality. The model identifies the risk. A weak intervention wastes the signal.
In late 2024, a UnitedHealth subsidiary operating under the “nH Predict” algorithm was automating coverage decisions for elderly patients at scale. The system’s reported accuracy was high enough to deploy at volume. Then the appeal data came in. According to a December 2025 analysis by NineTwoThree, the algorithm’s error rate on human appeals was 90% — nine out of ten times a physician reviewed the AI’s denial, they overturned it. The model wasn’t predicting medical appropriateness. It was predicting cost reduction, which it did accurately. The two metrics looked identical on the vendor dashboard and diverged catastrophically in the real world.
This is not a healthcare story. It’s a calibration story. The model was optimized for the wrong outcome variable. It reported high accuracy on that variable. The underlying goal — appropriate coverage decisions — was never measured. Marketing teams running propensity models face the same structural trap on a smaller scale: the model is accurate at predicting who clicks, not who derives value. When “engagement” and “incrementality” are conflated, the model earns high dashboard scores while quietly destroying net revenue.
The accountability shift described earlier is not only a vendor problem. Marrina Decisions’ January 2026 practitioner analysis documented a pattern that was widespread across B2B organizations in 2025: predictive lead scoring that “worked” on the dashboard and eroded sales trust over 18 months. The mechanism was simple. Models were trained on historical engagement data — email opens, form fills, website visits. They correctly predicted who would engage with sales outreach. What they were not measuring was buying intent, deal progression, or revenue conversion. SDR teams acted on high-score leads. Conversion from scored lead to closed revenue stayed flat or declined. Sales leaders stopped trusting the scores. Marketing ops doubled down on retraining the model with more features. The scores got more precise. The revenue impact didn’t change. The model was doing its job. The job was wrong.
The precise number: Marrina Decisions found that predictive scoring “struggled when organizations treated scores as definitive indicators of buying intent rather than probabilistic guidance.” That gap — between probabilistic guidance and definitive indicator — is where practitioner ROI goes to die.
When Should You Actually Deploy a Predictive Model? A Decision Framework
Every competitor article tells you how to build one. This is the question they skip: should you?
There are four conditions that must all be true before a predictive model will earn a positive ROI in a marketing context. Not two out of four. All four.
- You have a measured outcome variable that is not a proxy. “Engagement” is a proxy. “Contract signed,” “subscription renewed,” “customer retained at 12 months” are outcomes. If your model’s training label is a proxy for the thing you care about — clicks predicting revenue, scores predicting intent — you will accurately predict the proxy while the real outcome drifts.
- Your data is large enough to have a stable signal-to-noise ratio in the segment you’re targeting. Models trained on enterprise-level data and deployed against SMB segments fail silently. The NIH/NCBI literature on model overconfidence is clear: overconfidence — where training error is misread as generalization error — is most dangerous with “modest or small sample sizes, powerful learners and imperfect data designs.” A random forest trained on 200,000 records does not behave like a random forest trained on 4,000.
- You can run a holdout group. No holdout, no incrementality measurement. No incrementality measurement, no way to distinguish “customers we won because of our campaign” from “customers who were going to win regardless.” This is the control group problem at the heart of uplift modelling. If your organization can’t run a holdout — legally, technically, or politically — you cannot measure whether the model is earning its cost. You can only measure whether it is producing activity.
- Your intervention has a meaningful effect on the customers the model identifies. A perfectly calibrated churn model that triggers a 5% discount to customers who would have churned anyway wastes money. A churn model that triggers a personal customer success call to customers on the threshold converts the signal into revenue. The model’s value is bounded by the intervention quality. High-confidence predictions paired with weak interventions produce accurate predictions of events you couldn’t prevent.
If any of these four conditions is missing, deploying the model is not neutral. The Berkeley CMR research is explicit: even technically correct models can yield negative outcomes “even if applied in a technically proper way” when the causal structure between intervention and outcome is misspecified. The model isn’t wrong. The deployment is.
“There are four conditions that must all be true before a predictive model earns a positive ROI. Not two out of four. Vendors will tell you to ship. The conditions don’t care.”
The deployment decision quadrant
Here is the framework compressed into a two-axis decision grid: data quality on the vertical axis, incrementality measurability on the horizontal.
Deploy with strict holdout architecture. Report on activity metrics only. Build toward incrementality measurement as a next milestone. Do not present dashboard activity as revenue impact.
The conditions for a real ROI conversation exist. Run the holdout. Measure lift against control. Retrain quarterly. This is the only quadrant where “our model is working” can be a defensible claim.
A model trained on sparse or proxy data without incrementality measurement is worse than no model — it produces confident-sounding decisions without a reliable signal. The dashboard looks fine. The P&L doesn’t.
Incrementality is measurable — this is recoverable. Invest in data infrastructure before the model. A well-instrumented holdout design with clean data outperforms a sophisticated model on dirty data every time.
How Do You Actually Build a Deployment-Ready Predictive Model?
The practitioner path, stripped of boilerplate. This assumes you’ve run the four-condition check and cleared it.
Step 1 — Define the outcome variable precisely
Write it in one sentence before opening a notebook. “Customers who renewed within 90 days of first risk flag” is an outcome variable. “At-risk customers” is not. The model learns what you measure. Measure the wrong thing with high precision and you get the wrong thing, confidently.
Step 2 — Split your data before any feature engineering
This is where most implementations introduce overconfidence. The NIH model overconfidence literature describes the failure precisely: “Protocol 3 / Partial cross-validation” — feature selection on all data, model built on a training split, error estimated on a test split — produces upward-biased error estimates. The model appears to generalize better than it does. The fix is strict temporal splitting: train on months 1–18, validate on months 19–24, test on months 25–30. Features derived from the test period cannot be used in training.
import pandas as pd
from sklearn.ensemble import GradientBoostingClassifier
from sklearn.metrics import brier_score_loss  # Calibration, not just accuracy

df = pd.read_parquet('customer_events.parquet')
df = df.sort_values('event_date')

# Strict temporal split — no data leakage
train = df[df['event_date'] < '2024-07-01']
test  = df[df['event_date'] >= '2024-07-01']

X_train = train.drop(columns=['renewed_90d', 'event_date'])
y_train = train['renewed_90d']

X_test  = test.drop(columns=['renewed_90d', 'event_date'])
y_test  = test['renewed_90d']

model = GradientBoostingClassifier(n_estimators=300, learning_rate=0.05)
model.fit(X_train, y_train)

# Brier score measures calibration quality, not just AUC
probs = model.predict_proba(X_test)[:, 1]
brier = brier_score_loss(y_test, probs)
print(f"Brier Score: {brier:.4f}")
# Lower is better. >0.25 on a binary outcome means poorly calibrated.
# A well-calibrated model: predicted 70% probability events happen ~70% of the time.
The Brier score line in that snippet is not an accident. AUC tells you the model ranks customers correctly. Brier score tells you whether the model’s probabilities are trustworthy — whether a 70% prediction actually corresponds to a 70% event rate in the test data. A model with strong AUC and poor calibration (high Brier) is dangerous in production: it identifies the right customers but assigns confidence levels that will cause your team to over-invest in lower-probability segments and under-invest in high-probability ones.
Step 3 — Design the holdout before you deploy
Size the holdout correctly. For a churn intervention on a 50,000-customer base with an expected 15% at-risk rate and a hoped-for 5% lift, you need roughly 3,500 customers per arm (treatment and control) at 80% statistical power to detect that effect. Use a power calculator — Evan Miller’s is the practitioner standard. If your at-risk segment is smaller than the required holdout, you cannot measure the model’s ROI. This is a real constraint, not a modeling footnote.
Step 4 — Report calibration alongside conversion
In your dashboard, show three numbers: predicted conversion rate, actual conversion rate in treatment, and actual conversion rate in holdout control. The difference between treatment and control is the only number that speaks to incrementality. If that difference is zero or negative, the model is not earning its deployment cost — regardless of what the predicted conversion rate looks like.
Tool Comparison: What the Pricing Tables Don’t Say
The original article’s tool table had seven rows and no failure information. Here’s a more useful version — shorter, annotated with where each tool’s model assumptions tend to break down.
| Tool | Best Use Case | Entry Cost (directional) | Where It Breaks Down | Incrementality-Ready? |
|---|---|---|---|---|
| Amplitude | Churn prediction, LTV forecasting for product-led growth companies | Free tier; paid from ~$995/month | Requires dense product-usage data; weak for e-commerce orgs without in-app behavior | Partial — has holdout tooling; uplift not native |
| Keen Decision Systems | Media mix modelling, budget scenario planning | Enterprise; typically $30K–$100K/yr | MMM assumptions require stable channel mix; reallocation outside historical range is extrapolation | Yes — built for incrementality and scenario planning |
| Salesforce Einstein | Lead scoring, send-time optimization inside Salesforce CRM | Included in Marketing Cloud Engagement; full AI from ~$1,250/org/month | Score quality degrades sharply when CRM data hygiene is poor; “garbage in” problem is systematic | No native holdout; requires workaround |
| Optimove | Retention campaign orchestration with predictive targeting | Custom; typically mid-market to enterprise | Optimized for customer retention at scale; poor fit for acquisition-stage orgs without sufficient transaction history | Yes — holdout groups and lift reporting are core features |
| Azure Machine Learning | Custom model development for teams with ML engineers | Pay-as-you-go; compute from ~$0.50/hour | Requires internal ML capability; no off-the-shelf marketing model; total cost of ownership is high when you include engineering time | Yes — full control, but calibration and holdout design are the team’s responsibility |
The “Incrementality-Ready?” column is the one to read first. Tools without native holdout support can still be used well — but they require your team to design and maintain holdout architecture manually. That engineering cost is real and typically underestimated. For teams below ~10,000 customers, that cost may exceed the expected model lift.
What Happens Between Now and 2027
Two patterns across independent sources are worth naming as genuinely likely developments, not market-forecast boilerplate.
The first: Gartner’s projection, cited in the AI Digital 2026 review, is that by 2028, 15% of day-to-day work decisions could be made autonomously — and that many early “agent” projects will be scrapped before 2027 without clear value and governance. The qualification matters. The organizations that maintain a human decision loop over model outputs, that instrument their holdouts correctly, and that report calibration alongside conversion will be positioned to absorb autonomous agent capabilities when they mature. The organizations that handed decision authority to their first propensity model without measuring incrementality will be trying to recover from 18 months of misdirected spend at the same time competitors are deploying second-generation agentic workflows.
The second: regulatory attention on algorithmic decision-making in marketing is tightening. The Data Axle 2026 practitioner guide notes that “governments and advocacy groups are scrutinizing how automated systems make decisions” and that explainability requirements are arriving across jurisdictions. A model that tells you “this customer should receive a retention offer” without surfacing the features driving that prediction will become a compliance liability, not just a data science gap. The SafeRent case — where a tenant screening algorithm was found to use college default rates as a proxy for race and settled for $2.2 million with mandatory independent fairness auditing under the consent decree — is the clearest preview of where unexamined marketing models can end up. Not because marketing models are targeting the same protected classes, but because the structural failure is identical: proxy variables, no explainability, no audit trail.
The de-escalation path — a world where marketing teams deploy models responsibly with holdouts and calibration reporting from the start — is narrow. It requires procurement teams to ask for Brier scores alongside AUC, and it requires vendor dashboards to surface holdout lift by default rather than burying it in settings. Those conditions are currently absent. What makes this worth naming rather than dismissing: the accountability shift described in Section 2 is already compressing the timeline. Sales leaders who lost trust in lead scoring in 2025 are now asking harder questions about model ROI. That pressure, if it reaches procurement, could change vendor dashboard defaults faster than any regulatory timeline. The path exists. Its arrival date is genuinely uncertain.
The Practical Implications
If you are a marketing practitioner, the immediate question is whether your current predictive model deployment includes a measured holdout group. If it doesn’t, you don’t know whether the model is earning its cost or consuming it. That is not a complex infrastructure problem — it is a decision problem. Someone decided holdout groups were operationally inconvenient. That decision is now invisible in your conversion metrics and visible in your flat net revenue.
If you are evaluating a new vendor, ask for the Brier score on their reference implementations and ask how they instrument the holdout. If they can’t answer both questions, they are selling you an accuracy story, not an ROI story.
If you are an executive with a model already deployed at scale, the accountability question is blunter: what is the incremental lift over the holdout group, measured over the last three quarters? If that number doesn’t exist in your current reporting, request it. The absence of the number is the finding.
For small businesses and teams without the data volume to support a statistically valid holdout: the churn prediction category is still accessible. First-party usage data with a clear outcome variable and a personal outreach intervention (not an automated email) can produce measurable retention lift at modest scale. The four-condition check still applies — but this is the category where the conditions are most achievable without enterprise data infrastructure.
The marketing organizations spending the next two years measuring their models’ calibration scores rather than their conversion rates will look, from the outside, like they’re being slow. They will be building the only thing that makes AI marketing spend defensible: evidence that the model caused the outcome, not just predicted it.