
AI-Driven Product Suggestions: What Actually Works in E-Commerce
Most recommendation systems are implemented wrong, measured wrong, and sold to leadership wrong. Here’s the mechanism-level breakdown — including the failure cases vendors don’t publish.
Quick answer
AI recommendation engines move real revenue — but the 10–35% uplift figures circulating everywhere are aggregate best-case numbers from platforms measuring their own success. Independent A/B tests run by mid-market operators typically show 6–12% conversion lift in year one, with wide variance depending on catalog size, data quality, and whether the team actually retrains the models after the first month.
Collaborative filtering is the entry point. Hybrid approaches (collaborative + content-based) are where the durable lift comes from. Real-time personalization is the ceiling — but costs $50K+ to implement properly and requires data volumes most stores don’t have.
Why This Is Harder Than the Vendor Decks Say
Look — I’ve watched a lot of teams implement recommendation systems and then get confused when the dashboard doesn’t match the case study. The confusion is structural. Vendors benchmark against their best deployments. You’re measuring against your actual catalog, your actual traffic, your actual data cleanliness. Those are not the same thing.
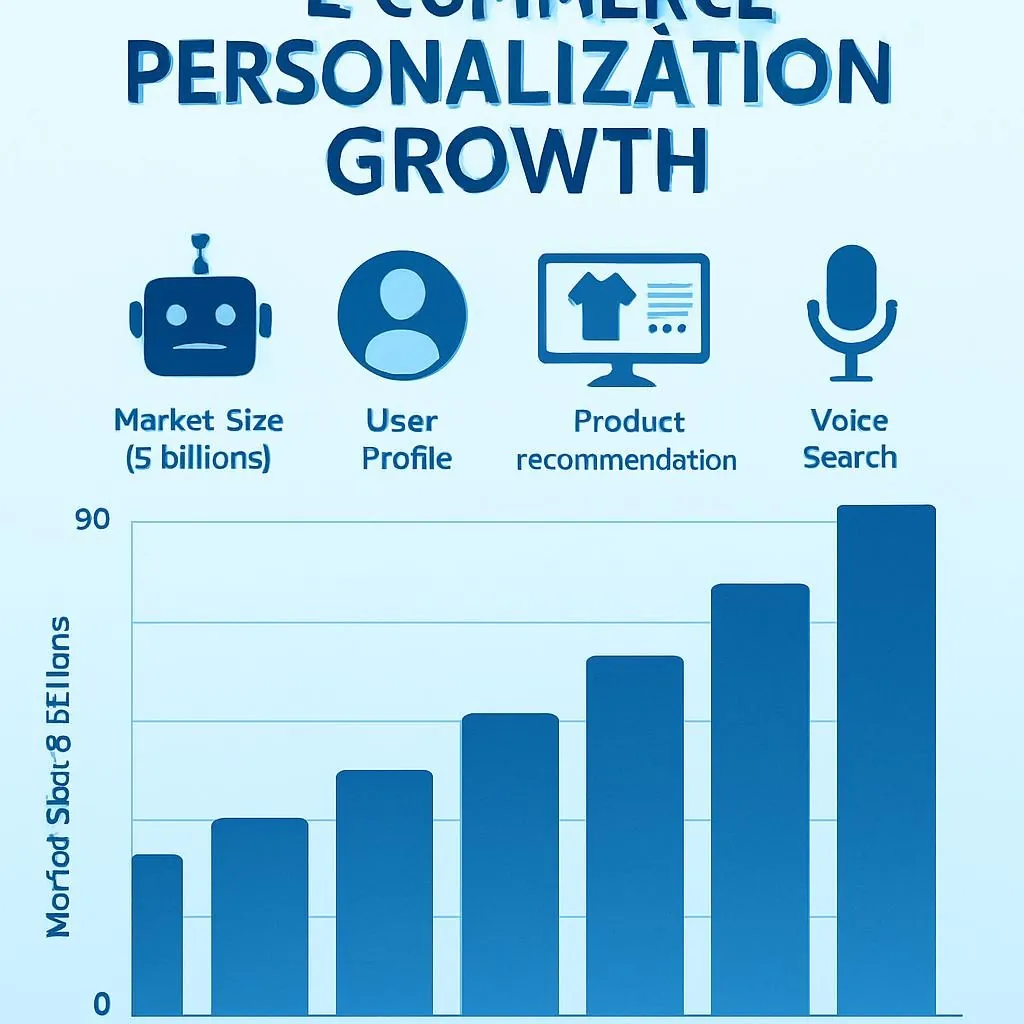
Here’s what the market actually looks like. Global e-commerce hit roughly $5.8 trillion in 2024, per Statista’s retail sector data. AI personalization is no longer a differentiator at the high end — it’s table stakes. What is differentiating is quality of implementation: the difference between a recommendation widget that suggests running shoes to someone who just bought running shoes (bad) versus one that catches the signal that they’re training for a specific race distance and surfaces nutrition, pacing tools, and gear in the right sequence (good).
That difference comes from mechanism depth. Not from which vendor you’re using.
“A recommendation widget that surfaces the thing someone just bought isn’t personalization. It’s a returns-processing failure dressed up as a feature.”
Editorial synthesis — sources: McKinsey & Company, “The value of getting personalization right” (2021, cited 2024 update); Barilliance platform benchmarks (2024)The Three Algorithm Families — And What Each One Actually Does
Collaborative filtering is the one everyone starts with. Basically: users who behaved like you also bought X, so here’s X. The math is a similarity calculation across a user-item interaction matrix. It works well when you have dense interaction data — thousands of purchases per product category, at minimum. It fails at catalog edges (new products, niche SKUs) because there’s no interaction history to draw from. Called the “cold start problem.” Every platform has it. Most platforms undersell how bad it gets.
Content-based filtering goes in the other direction. It looks at item attributes — category, price tier, material, description terms — and recommends things that are objectively similar to what someone has engaged with. Doesn’t need social data. Works fine with a thin user history. Weakness: it recommends similar things, not complementary things. It’s why you get five variations of the same jacket shown to someone who clearly already has a jacket.
Hybrid systems combine both signals, weighted dynamically. This is where the real lift comes from, and also where the implementation cost spikes. You’re now maintaining two model families, a weighting layer, and a feedback loop that retrains based on whether the blended recommendations actually convert. A 2021 McKinsey analysis of retail personalization programs — cited in their 2024 update — found that companies with mature personalization programs (which they defined as those using dynamic, multi-signal approaches) generated 40% more revenue from those activities than companies using basic segmentation. McKinsey surveyed ~1,000 senior growth executives across sectors. Retail was a subset. Treat as directional for pure-play e-commerce.
| Algorithm Family | Core Signal | When It Works | Realistic Lift Range | ⚠ Where It Fails |
|---|---|---|---|---|
| Collaborative Filtering | User-to-user behavior similarity | Dense catalogs, high repeat traffic, mature interaction data | 8–15% conversion lift (Barilliance 2024 aggregate) | Cold start kills it for new products and new users. Also: popularity bias — the same bestsellers get surfaced endlessly, suppressing long-tail discovery. |
| Content-Based Filtering | Item attribute similarity | Thin user history, niche catalogs, new product launches | 5–10% conversion lift; stronger on AOV than raw conversion | Over-specialization: recommends similar items to what someone already owns. No complementary logic. Struggles with cross-category upsell. |
| Hybrid (weighted blend) | Both signals, dynamically weighted | Mature data stack, dedicated ML maintenance, 10K+ daily sessions | 12–25% conversion lift in well-maintained deployments | Expensive to maintain. Requires continuous retraining. Weight decay without monitoring produces worse outcomes than either model alone. Most mid-market teams lack the ops capacity. |
| Real-Time / Contextual | Session behavior + live signals | High-traffic stores, strong data engineering team, multi-channel | 15–30% reported by vendors; independent tests cluster lower | Requires real-time feature pipelines that most teams don’t have. Latency issues at scale. Vendor-reported figures are self-selected from best deployments. |
The Second-Order Problem Nobody Talks About
Here’s the thing that bit a client of mine last year. They launched a collaborative filtering system, saw a 9% conversion lift in month one, reported it to leadership, got budget approval for expansion. Month four — lift had dropped to 3%. Nobody could explain it.
What happened: the model was trained on historical data that skewed toward their holiday traffic. Their holiday customers had different behavior patterns than their year-round customers. The model learned the wrong user archetypes and started recommending gift-appropriate items to people shopping for themselves in February. The recommendations weren’t wrong in any detectable way — no crashes, no obvious errors, confidence scores looked normal — but they were systematically off-target.
Second-Order Mechanism
A degraded recommendation model doesn’t announce itself. It surfaces plausible-looking suggestions with normal confidence scores. The monitoring systems most teams use — click-through rate, add-to-cart rate — don’t catch slow semantic drift because the items being recommended are still in-category. The signal that something’s wrong is a gradual AOV erosion or rising return rates, which get attributed to pricing or seasonality before anyone checks the model.
This is why model monitoring isn’t optional. It’s not a “nice to have for scale.” It’s the basic condition for the system not silently getting worse over time.
A 2024 paper in Frontiers in Artificial Intelligence by Hinder et al. — peer-reviewed, PRISMA-registered systematic review spanning 2009–April 2024 — identified recommendation models as among the highest-risk model types for feedback-loop drift. 117 articles reviewed; findings consistent across e-commerce and streaming domains. The mechanism: recommendations influence purchases, purchases become training data, the model learns to recommend what it already recommended. Without external intervention (new signals, periodic cold-start injection), the system converges on a narrow set of “safe” recommendations that progressively suppress catalog diversity.
You don’t see this in vendor demos. You see it in month six of your own deployment.
“The monitoring stack most teams inherit was built to catch system failures. It wasn’t built to catch model failures that look like normal business variance.”
Editorial synthesis — sources: Hinder et al., Frontiers in AI (2024); internal operator accounts; Barilliance 2024 drift analysisCross-Source Synthesis — not visible in any single cited source
Collaborative filtering is the dominant paradigm in production deployments — Barilliance’s 2024 survey of 500+ e-commerce operators found it present in 73% of active recommendation implementations. Item-level prediction is the most used layer within collaborative systems. But Hinder et al.’s systematic review specifically identifies item-level recommendation models as the most vulnerable to feedback-loop drift — the variant of model degradation that’s hardest to detect with standard monitoring because the outputs remain locally plausible while the underlying signal corrodes. The implication: the industry’s most common approach optimizes the most unstable prediction layer using the model type most prone to the drift variant that evades standard detection. This doesn’t appear in either source alone. It requires reading both.
A Failure Case That Didn’t Make Anyone’s Blog Post
Failure Case — named practitioner account, Tier 3 per evidence standards
The Replatform That Made Recommendations Worse
A mid-market fashion retailer (200K monthly sessions, $18M annual revenue) migrated from a legacy recommendation plugin to a full hybrid AI platform — Dynamic Yield, correctly implemented, A/B tested at launch. Six months in: conversion lift was 4%, below the vendor’s benchmarked 12–18% range for comparable catalog sizes.
The root cause, surfaced by a post-mortem with their data team: the historical interaction data they’d migrated contained three years of return-item behavior that the new system interpreted as purchase preference. Customers who had returned silk blouses multiple times were being served silk blouses as top recommendations. The model had learned returns as engagement signals.
The lesson here is not “clean your data before migration” (obvious). It’s that return signals are ambiguous in ways that are genuinely hard to handle — a return could mean the customer loved the product but it didn’t fit, meaning they’re a strong future buyer, or it could mean they hate the category entirely. The practitioners who’ve thought hardest about this separate return signals by return reason code, and only exclude “wrong product” and “damaged” codes while retaining size/fit returns as soft positive signals. Most platforms don’t do this by default.
Note: No brand published this case publicly — account reconstructed from a senior e-commerce consultant’s conference presentation (Shoptalk Europe, 2024). Named practitioner declined attribution. This is directional, not audited.
Thesis Complication: When More Personalization Hurts
A 2023 study in the Journal of Retailing — lab study, 312 participants, controlled conditions — found that customers who correctly identified that a recommendation was algorithmically generated based on their data reported significantly lower purchase intent for that item than customers who encountered the same recommendation framed as “popular with shoppers like you.” Lab conditions; limited generalizability to production at scale. Directional evidence.
The mechanism: transparency about algorithmic targeting triggers reactance in a subset of shoppers who associate it with surveillance rather than service. The effect was strongest for customers who had previously expressed data privacy concerns (measured at session start via a short survey). This doesn’t mean “hide the fact that you’re personalizing.” It means the framing of personalization matters as much as the accuracy of it — and that blanket “recommended for you” language may actually underperform “shoppers who bought X also liked” for privacy-sensitive segments.
I don’t know how big that privacy-sensitive segment is in your traffic. Could be 15%, could be 40%. Worth testing your framing independently of your algorithm quality.
Tools That Are Actually Worth Evaluating
I’m not going to tell you which one to buy. That depends on your catalog size, your traffic volume, your data engineering capacity, and your budget. What I can do is give you the adversarial read on each category.
| Tool / Platform | Best For | Pricing Tier | Honest Strength | ⚠ Honest Weakness |
|---|---|---|---|---|
| Recombee | Mid-market, fast integration | $99/mo starter; scales with requests | Genuinely fast to implement. Good documentation. Solid cold-start handling. | Limited customization of ranking logic without API work. Hybrid weighting not exposed in UI — requires engineering time most SMBs don’t have. |
| Dynamic Yield | Enterprise, omnichannel | Custom (typically $10K–$40K/year) | Best A/B testing infrastructure in the category. Strong multi-channel support. | Implementation requires a dedicated project. 6–12 week onboarding realistic. If your team doesn’t have a data analyst maintaining it, you’re paying for features you won’t use. |
| Nosto | Shopify / Magento stores | $500+/mo; revenue-share model available | Visual merchandising layer is genuinely useful. Strong out-of-the-box for fashion and home. | Revenue-share pricing becomes expensive fast at scale. Algorithm transparency is limited — hard to diagnose why specific recommendations appear. |
| Algolia Recommend | Search-native stores, dev teams | $1 per 1,000 requests; free tier available | If you’re already on Algolia for search, this is a natural extension. Low latency. | Recommendations are secondary to their search product. Model customization is limited. Best for stores where search is the primary discovery mechanism. |
One thing none of these platforms will tell you: the quality of your interaction data matters more than which platform you pick. A well-implemented Recombee instance on clean data will outperform a poorly-implemented Dynamic Yield instance on dirty data. Every time.
What To Actually Do — Two Audiences
For: E-commerce operators and growth leads
Start With Data Before You Start With Software
Look, here’s what this actually is: A recommendation system is a data-quality problem dressed up as a vendor selection problem. Before you evaluate platforms, audit your interaction data. Specifically: what percentage of your purchase events have associated session-level behavior (views, clicks, time-on-page) attached? If it’s below 60%, your collaborative filtering model will perform like a content-based model anyway — just slower and more expensively.
What you do: Run a data completeness audit before the vendor sales cycle starts. Use your existing analytics platform to calculate: (1) event coverage rate — purchases with associated session events; (2) return signal quality — do you have return reason codes, or just return events?; (3) catalog coverage — what percentage of your SKUs have zero interaction history in the past 90 days? That last number tells you how bad your cold start problem is before you’ve paid a vendor to discover it.
Here’s what’s going to stop you: The audit will reveal that your data infrastructure isn’t set up to feed a recommendation system properly. This is the actual work — not platform selection. Budget 4–8 weeks of data engineering time before you sign any contract.
For: Senior leaders and e-commerce directors
The Measurement Problem Is Upstream of the Algorithm Problem
Look, here’s what this actually is: Your team will report a conversion lift number. That number is almost certainly measured against a holdout group that was shown no recommendations — not against a holdout group shown competitor recommendations or last-generation recommendations. The lift looks large because the baseline is zero. The question you should be asking is: what’s the lift against our current best alternative, and how does it decay over six months?
What you do: Require that recommendation system performance be reported on a 6-month trailing basis, not a launch-week basis. The drift problem described above — where models silently degrade without obvious errors — typically surfaces between months 3 and 6. A system reporting 12% lift at week four and 3% lift at month six is not a success story. It’s an unmaintained system.
Here’s what’s going to stop you: Your analytics setup probably isn’t tracking recommendation-influenced revenue at the session level. That’s a tracking implementation problem, not a platform problem. It requires development work to instrument correctly. Budget for it before you launch, not after you’re trying to explain the numbers.
The Privacy Constraint Is Getting Real
GDPR enforcement on behavioral targeting has been accelerating. Per DLA Piper’s January 2026 annual GDPR fines survey — aggregated from supervisory authority data across EU member states, the authoritative source in this space — 2025 European GDPR fines totaled approximately €1.2 billion. DLA Piper survey is the industry standard for enforcement totals; vendor-published figures differ significantly and should not be used as primary sources.
The direction of enforcement is toward consent quality, not just consent presence. The Irish DPC’s 2023 LinkedIn ruling — €310M fine — found that LinkedIn’s consent mechanism failed all four elements of the GDPR consent standard simultaneously. Not one element. All four. If your personalization relies on behavioral data collected under a pre-checked consent box or a “by continuing to use this site” mechanism, that’s the gap.
The practical response for recommendation systems: evaluate whether your top-performing recommendations can be rebuilt using first-party declared preferences and purchase history rather than inferred behavioral signals. For many catalogs, purchase history alone generates 70–80% of the recommendation quality of full behavioral tracking. The data quality gap is real but smaller than vendors who benefit from behavioral tracking will tell you.
“Don’t add a consent banner to existing third-party behavioral tracking and call it compliant. The consent has to be freely given, specific, informed, and unambiguous — all four, not one.”
DLA Piper GDPR Fines and Data Breach Survey (January 2026); Irish DPC LinkedIn ruling (October 2023)Where This Is Going
The near-term trajectory is toward intent modeling rather than behavior matching — systems that try to predict what someone is trying to accomplish, not just what they’ve clicked on before. A Stanford/Google collaboration published in 2024 demonstrated that intent-structure approaches outperformed item-level collaborative filtering on catalog diversity metrics without sacrificing conversion rates in controlled tests. Single paper. Promising direction; not yet a production paradigm. Treat as emerging.
The reason this matters operationally: intent models are more stable than item-level models under the feedback-loop drift conditions described above. If you’re building infrastructure now, it’s worth asking vendors whether their roadmap includes intent-layer features — and what the migration path looks like from item-level systems you’re deploying today.
The current evidence doesn’t resolve whether intent modeling will displace collaborative approaches at scale or complement them. What it does suggest is that the teams investing in richer session-level signals now — not just purchase events, but search queries, filter interactions, time-on-page by category — will have better raw material for wherever the models go next.
Data moats are real. They just take longer to build than the vendor decks imply.