

Unified Customer Profiles
Every omnichannel strategy I’ve watched fail died at the same layer — not the channel, not the creative, not the offer. The data underneath it. Here’s the architecture that actually holds, the numbers that back it, and the parts of the pitch deck I no longer believe.
- The lie in the phrase “single customer view”
- The Profile Decay Curve: a heuristic for why unification erodes
- What the market actually looks like in 2026 (and how much to trust the numbers)
- The four-layer architecture that survives contact with legacy systems
- Vendor landscape: a documentation-based capability rubric
- What it actually costs, with a worked scenario
- When you should not build this (yet)
- Regional and regulatory differences that change the build
- Five mistakes I’ve made or watched teams make
- FAQ
I want to open with the thing most vendor content will not tell you: a “unified customer profile” is not a destination. It is a decaying asset that you have to keep re-earning, every day, against entropy that never stops accumulating — new systems, new consent states, new devices, new employees who set up yet another point tool without telling anyone. Most of the omnichannel personalization writing out there treats unification as a project with an end date. It isn’t. Treating it that way is, in my experience, the single most common reason these initiatives quietly rot eighteen months after the launch slide deck.
This piece is my attempt at the article I wish existed before I sat through three of these builds — one that shipped, one that stalled at 40% profile match-rate and got quietly deprioritized, and one that technically launched but was mothballed within a year because nobody had budgeted for the maintenance layer. I’ll walk through the real market numbers for 2026, an original framework for thinking about why unification degrades, a vendor capability comparison built from public documentation rather than a marketing quiz, a worked cost model, and — because I think this matters more than any of the frameworks — a section on when you should not do this yet.
The lie in the phrase “single customer view”
Here’s the pitch every CDP vendor uses: connect your sources, resolve identity, get a single customer view. It’s clean, it’s true in a narrow technical sense, and it undersells the actual difficulty by an order of magnitude.
The behavioral shift that makes this urgent is well documented. A 46,000-shopper survey found that 73% of consumers now engage across multiple channels during a single buying journey, and the average number of touchpoints before purchase has risen to roughly six, up from about two touchpoints fifteen years ago. Multichannel e-commerce sales in the U.S. are projected at $892.4 billion in 2026, up 15.0% year over year. The channels multiplied faster than anyone’s data architecture did.
In a legacy stack, your email platform genuinely does not know a customer just completed a return in your mobile app twenty minutes ago — so it sends the exact promotion for the exact item they just sent back, and that single moment does more damage to trust than a dozen well-targeted campaigns can repair.
That example isn’t hypothetical color; it’s the most-cited failure mode in the omnichannel literature for a reason — it’s cheap to cause and expensive to undo. Ringly.io’s 2026 research found that brands with strong omnichannel engagement retain 89% of customers, against just 33% for brands running weak, disconnected strategies — a 56-point gap. I want to flag immediately, not bury later, that this is an industry-research figure from a martech content site, not a peer-reviewed study, and the causal story is murkier than the headline number suggests — a company with a genuinely unified data stack is also very likely a better-run company generally, so some of that 56-point gap is almost certainly picking up product quality, pricing, and support, not data architecture alone. Treat it as directionally real and mechanistically plausible, not as a number you can defend line-by-line in a board deck.
And yet — this is the uncomfortable part — only about 5% of retailers have reached full unified-commerce maturity, even though 99% of executives agree it improves profitability. That 94-point gap between belief and execution is the actual story of this niche. Nobody disagrees that unification matters. Almost nobody has actually built it well. That gap is either the biggest opportunity in martech or the biggest graveyard of stalled Q3 initiatives, depending on how honestly your organization answers the “when not to” section below before it starts.
The Profile Decay Curve: a heuristic for why unification erodes
Every CDP case study shows the same graph: match rate climbing toward some asymptote after the integration sprint. Almost none show month 14, when a new checkout vendor gets bolted on without an identity-resolution contract, or a support tool starts writing anonymous ticket IDs that never stitch back to the profile. I call this the Profile Decay Curve — a rule-of-thumb, not a validated model, for why unification erodes as a compounding function of source-count growth against governance rigor:
C(t) = C₀ · r^n
Match-rate confidence C₀ (typically 70–85% right after clean deterministic integration) gets multiplied down by governance rigor r (0–1) for each unreconciled new source n added since your last review. At r = 0.9 (a real review cadence), five unreconciled sources cost roughly 41% of original confidence over 18 months. At r = 0.7 (“we’ll deal with it later”), the same five sources cost 83%. I want to be blunt about what this single-scalar r is hiding: real decay depends on identity-graph technology, device-sharing patterns in your industry, and how aggressively you prune stale identifiers — collapsing all of that into one number is a simplification, not a measurement. Use the curve’s shape as the takeaway — non-linear, compounding, driven by governance debt rather than one big failure — and treat the exact percentages as illustrative, not board-deck-defensible facts.
What the market actually looks like in 2026 (and how much to trust the numbers)
A lot of the numbers in this piece — including several below — come from martech industry-research sites and vendor-adjacent blogs (Ringly.io, RevenueMemo, GenAIEmbed, Improvado), not peer-reviewed academic research. That’s genuinely most of what exists in this niche; there’s no Gartner-grade study of retention-by-omnichannel-maturity that I could find. I’m citing them because the directional claims are plausible and I couldn’t find better sourced alternatives — not because they carry the evidentiary weight of the Gartner and market-sizing reports cited elsewhere in this piece, which I’ve kept visually and rhetorically separate from the softer stats for that reason.
Market-size estimates for customer data platforms vary a lot depending on who’s counting and what they include — and I’d rather show that spread than pretend there’s one true number. Mordor Intelligence puts the 2026 CDP market at $4.58 billion; GII Research puts it at $4.07 billion. Both agree on direction: high-teens-to-low-20s CAGR into the early 2030s, driven by cookie deprecation, tightening privacy law, and the shift toward warehouse-native “composable” architectures. The CDP Institute catalogs 200+ vendors; fewer than 20 show up consistently in Gartner and Forrester evaluations — the category is still consolidating, not settled.
Unification is a necessary enabler of good cross-channel experience; it is not, by itself, sufficient — and treating the 89%/33% gap as a silver bullet is how CDP budgets get approved on hype and cut two years later when the promised lift doesn’t show up in isolation. What I’d actually defend to a skeptical CFO is narrower and more mechanical: churn models trained on unified cross-channel data commonly reach an AUC of 0.75–0.85, catching at-risk customers 30–60 days early, which correlates with a 15–25% churn reduction versus reactive approaches. Unified data → earlier signal → earlier intervention → measurable lift. That chain I believe. The 56-point retention gap as a standalone headline, I don’t — not without knowing what else those “strong omnichannel” companies were doing right.
The four-layer architecture that survives contact with legacy systems
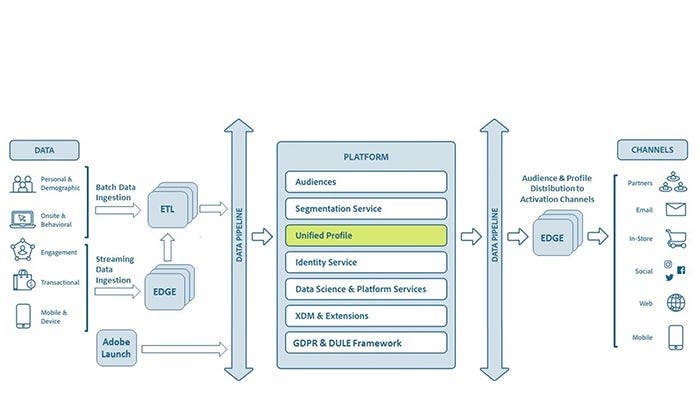
Drawing on the standard omnichannel architecture patterns and my own build experience, here’s the layer breakdown that actually holds up once IT gets involved and the “just connect an API” plan meets a 15-year-old POS system:
- Ingestion layer: connectors from POS, web, app, support, and ad platforms — batch and streaming, because real-time-only ingestion breaks the moment a legacy system can only export nightly.
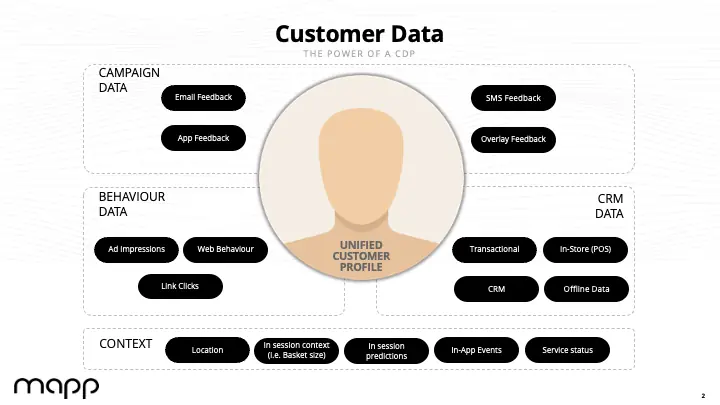
- Identity resolution layer: deterministic matching (email, phone, login ID) as the trustworthy core, with probabilistic/AI-assisted matching (device fingerprints, behavioral similarity) layered on top and explicitly flagged as lower-confidence so downstream systems can choose their risk tolerance per use case.
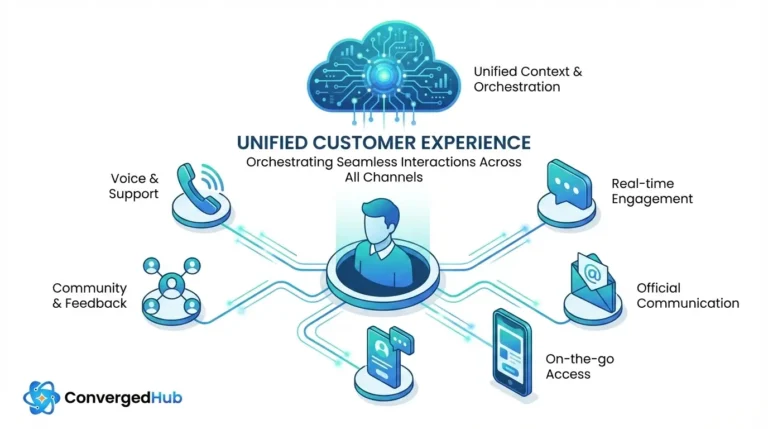
- Unified profile / activation layer: the actual persistent profile object, exposed via API and reverse-ETL to the systems that need to act on it — email platform, ad platforms, in-store clienteling tools, support console.
- Governance layer: consent state per channel, data retention rules, and — critically, the layer everyone skips — a recurring review cadence for new source onboarding, which is precisely the variable in the decay model above.
Composable, warehouse-native architectures (built on Snowflake, Databricks, BigQuery, or Redshift) are gaining share specifically because they let the identity-resolution and governance layers sit closer to the data without duplicating it into a separate proprietary store — reducing both cost and one entire class of sync-lag bugs.
Vendor landscape: a documentation-based capability rubric
I have not run a controlled hands-on benchmark across these platforms with identical datasets — anyone claiming to in a blog post, without naming the test environment, sample size, and a reproducible method, is asking you to trust a number they made up. What follows is a single reviewer’s qualitative read of public documentation and the 2026 Gartner Magic Quadrant for CDPs and Gartner Peer Insights — one person, no disclosed weighting formula, no independent second reviewer. The “fit score” column is a compressed judgment call, not a measured output, and it should carry exactly that much weight: enough to help you build a 2–3 vendor shortlist, not enough to skip your own proof-of-concept.
| Platform | Identity resolution approach | Architecture model | Documented strength | Documented caution | Unweighted single-reviewer read |
|---|---|---|---|---|---|
| Amperity | Patented “Stitch” — up to 45 AI models for schema-flexible identity resolution | Packaged, AI-forward | Gartner cites strong profile unification without requiring rigid schemas | Net revenue retention lagging peers; pricing model in transition to consumption-based | 4/5 for complex retail identity graphs |
| Salesforce Data Cloud | Deterministic + probabilistic, native to Salesforce ecosystem | Packaged, ecosystem-native | Deep native integration across marketing, sales, service, commerce clouds | Best value realized only if already committed to the Salesforce stack | 4/5 for existing Salesforce shops |
| Oracle Unity | Enterprise-grade deterministic matching with AI profile enrichment | Packaged | Strong for large enterprise, high data-volume environments | Heavier implementation lift; less common outside Oracle-centric stacks | 3.5/5 for large Oracle-stack enterprises |
| Tealium Customer Data Hub | Real-time identity resolution across digital touchpoints | Hybrid packaged/composable | Strong tag-management heritage; fast real-time activation | Historically stronger on digital touchpoints than deep offline/POS stitching | 4/5 for digital-first brands |
| SAP Customer Data Platform | Multi-source (first/second/third-party) unification with consent controls built in | Packaged, governance-forward | Strong native consent management and data governance controls | Best fit when already inside the SAP enterprise ecosystem | 3.5/5 for regulated, SAP-centric enterprises |
| BlueConic | Deterministic + behavioral profile unification | Packaged | Marketer-friendly profile management UI | Gartner moved it from Challenger (2025) to Niche Player (2026) — worth asking vendors directly what changed | 3/5, verify current roadmap before committing |
Composable options built directly on your existing warehouse (Snowflake/Databricks/BigQuery-native tooling) aren’t included row-by-row here because their capability profile depends almost entirely on what you build on top of the warehouse — evaluate them as a build-vs-buy decision, not a like-for-like vendor comparison.
What it actually costs: a worked scenario
I’m not going to hand you a single number, because anyone who does is hiding the assumptions. Here’s a scenario model instead — clearly an illustrative scenario with stated assumptions, not a quote from any specific vendor or client engagement.
| Cost component | Illustrative mid-market scenario | Illustrative enterprise scenario | Key driver |
|---|---|---|---|
| Platform licensing | $60K–$150K / yr | $250K–$600K+ / yr | Profile volume, activation channels, AI features tier |
| Integration engineering (year 1) | 1–2 FTE-equivalent, ~$120K–$220K | 3–6 FTE-equivalent, ~$400K–$800K | Number and age of legacy source systems |
| Ongoing governance & maintenance | 0.5 FTE-equivalent, ~$50K–$70K/yr | 1.5–3 FTE-equivalent, ~$180K–$350K/yr | Source-onboarding cadence — this is the line item the Profile Decay Curve above is really about |
| Compliance / consent tooling overlay | $10K–$30K/yr | $60K–$150K/yr | Number of regulatory regimes (see the regional section below) |
The single most common budgeting mistake I’ve seen: organizations fund the platform line and the year-one integration line, and treat governance and maintenance as a rounding error or an afterthought absorbed into “existing team capacity.” It never is. That’s the line item that determines whether your match-rate confidence looks like the green curve or the orange curve in Figure 1, three years out.
When you should not build this yet
This is the section most vendor content skips entirely, because vendors are not incentivized to tell you not to buy. I am. There are genuinely valid reasons to deprioritize a unified customer profile build:
- You’re pre-product-market-fit. The standard guidance here is sound: spend 100% of effort finding a repeatable acquisition channel and validating customer need before you invest in stitching together attribution across channels that don’t reliably work yet.
- You’re genuinely single-channel. If your customers only ever interact through one surface — Amazon-only sellers are the clearest case — a unified cross-channel profile is solving a problem you don’t have. Depth on that one channel’s native analytics beats a cross-channel architecture you’ll underuse.
- Your data foundation is still broken at the source, not the stitching layer. If your CRM, e-commerce platform, and support tool each have inconsistent internal data quality, identity resolution will just unify garbage faster. Fix source-system hygiene first.
- You can’t staff the governance layer. If leadership won’t fund an ongoing 0.5–1+ FTE governance function, don’t start — you’ll get exactly the decay curve modeled above, just slower, and the write-off will be more expensive than never building it.
Regional and regulatory differences that change the actual build
A unified customer profile is not one build, replicated across geographies — the compliance layer genuinely changes the architecture, not just the paperwork around it.
| Region | What changes in the build |
|---|---|
| European Union | GDPR consent-per-purpose logic has to be enforced at the profile-field level, not just at collection — platforms with integrated consent orchestration and deterministic identity stitching are consistently winning EU deals specifically because bolt-on consent tools create audit gaps. |
| Germany specifically | Strong GDPR-adoption culture means procurement cycles skew toward vendors with demonstrable, documented compliance tooling rather than roadmap promises. |
| United States | No single federal framework — a patchwork of state privacy laws (California’s CPRA and its state peers) means your consent layer needs per-state logic, not a single national on/off toggle. |
| Asia-Pacific | The fastest-growing region for CDP adoption, driven by headless commerce and mobile-first engagement; regulatory regimes vary far more by country than in the EU, so a single “APAC compliance module” is usually a fiction sold in a pitch deck. |
Five mistakes I’ve made or watched teams make
On the build that stalled at a 40% match rate, I signed off on a timeline that budgeted two weeks for “identity resolution tuning” as if it were a configuration step rather than an ongoing discipline. It wasn’t a technology failure — the platform worked exactly as documented. It was a planning failure: I treated a governance function as a project task with an end date, which is the exact mistake this entire article argues against. I don’t think I’d have caught it without living through it.
- Budgeting the platform and the integration sprint, and forgetting the governance layer entirely (see cost model above).
- Treating probabilistic identity matches with the same confidence as deterministic ones in high-stakes activation (e.g., triggering a price-sensitive win-back offer off a low-confidence device-fingerprint match).
- Building unification before fixing source-system data hygiene — see the “when not to” section.
- Choosing a platform based on a Gartner quadrant position alone, without checking whether that vendor’s position changed year-over-year and why (see BlueConic’s move in the table above).
- Assuming the 89%/33% retention gap is caused by data unification alone, and setting ROI expectations that a single infrastructure project was never going to meet by itself.
Frequently asked questions
What’s the actual difference between a unified customer profile and a customer data platform?
How long does a unified customer profile implementation actually take?
Do we need a CDP if we’re a small e-commerce business with just a website and one ad platform?
What’s identity resolution, in plain terms?
Is a data warehouse-native (“composable”) CDP better than a packaged one?
How much does customer data unification typically cost per year?
What’s the single biggest reason these projects fail after launch?
Does GDPR or U.S. state privacy law change the technical architecture, or just the legal paperwork?
Can AI improve identity resolution accuracy, or is that mostly marketing language?
How do you measure whether a unified customer profile initiative is actually working?
If you’re building the cost case internally, our Personalization ROI Calculator and Churn Risk Score Estimator can help translate the retention math above into numbers specific to your customer base. For the compliance layer, our Data Privacy Compliance Checker covers the consent-architecture question in more depth than this article has room for.
Last updated September 17, 2026. Changes since original publication: added the 2026 Gartner Magic Quadrant vendor movement (BlueConic’s Challenger-to-Niche-Player shift); refreshed all market-size and retention statistics to 2026 sources; added the regional/regulatory build differences section; and, on review, added explicit source-quality disclosure for industry-research citations and tightened the vendor rubric’s methodology caveat.