
A vision-AI team at Roboflow describes a pattern that should make any project lead uneasy: a model that scores 96% accuracy in testing can fall to about 71% once it runs on a real factory floor (Roboflow). Same model, same code. Dust, lighting changes, vibration, and operator habits did the rest.
Hold that number loosely, because it comes from a vendor writing about its own field. But the shape of the problem is real, and it shows up well beyond cameras. A pilot proves a model can work. Production proves your organization can keep it working, safely, on the days nobody is watching.
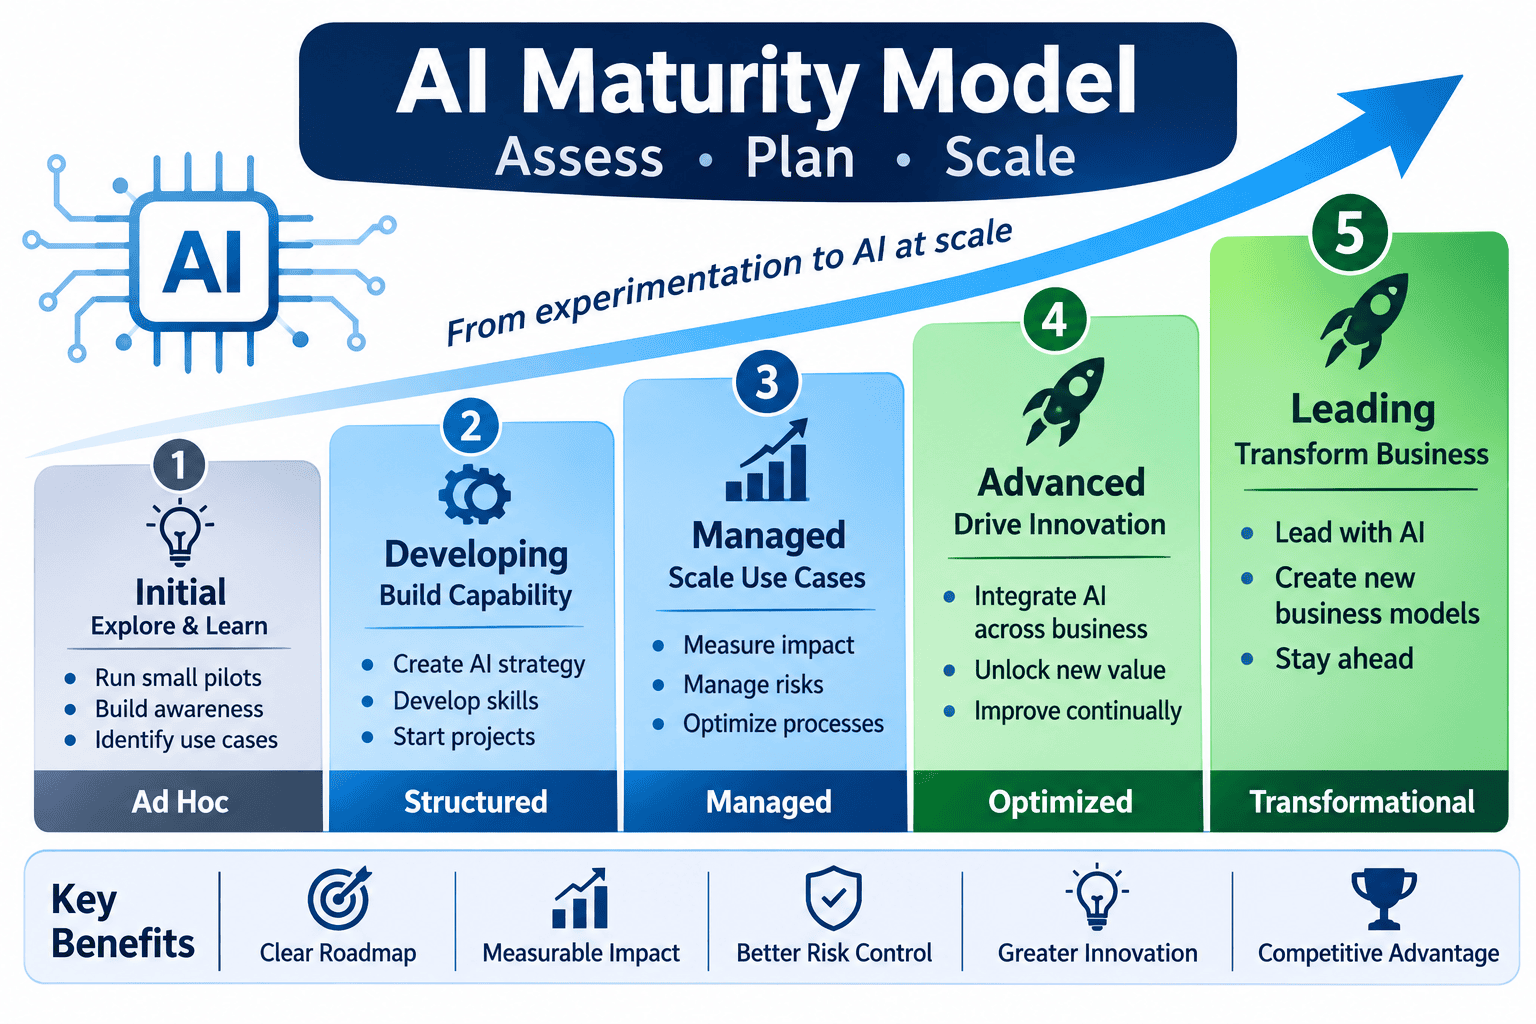
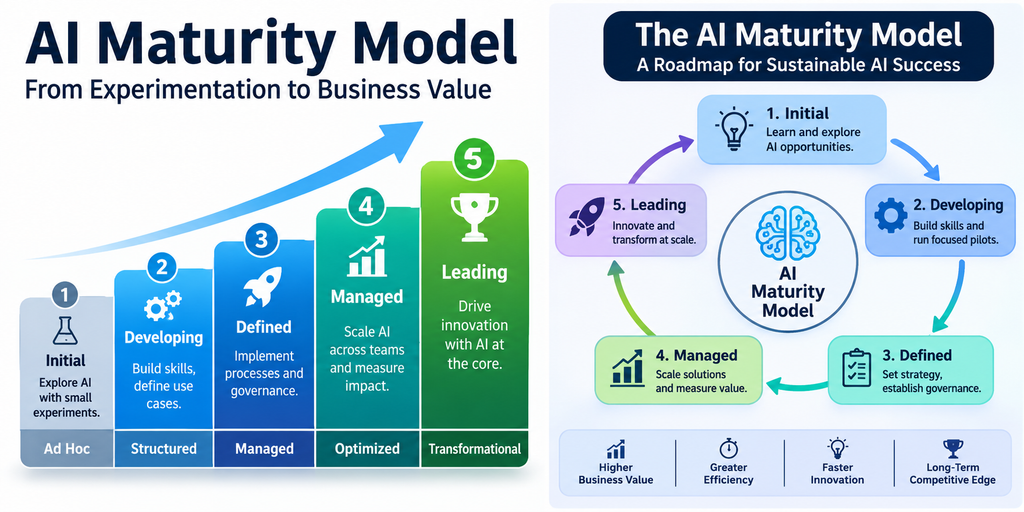
Most “AI maturity model” articles stop at a ladder of five levels with friendly names. This one does something different. It offers a framework, then tests it against five documented cases, two of them successes and three failures, and shows exactly which step each one skipped. At the end, there’s a worksheet you can use this week.
Short answer, if you’re in a hurry: an AI integration is mature not when it’s impressive, but when it has a named owner, a way to measure quality in production, a defined failure path, and a use case someone is accountable for. Everything below is a way to check that.
First, a word about the famous “95%.”
You’ve probably seen the claim that 95% of generative AI pilots fail. It comes from MIT’s NANDA initiative report, The GenAI Divide: State of AI in Business 2025, and it has been repeated in hundreds of articles (Fortune coverage, syndicated).
It’s worth knowing how contested it is. Wharton’s Kevin Werbach said the survey data behind the figure was unclear, with little transparency on method or sample size (GovInfoSecurity). Other commentary noted that the study named none of the 52 firms it surveyed (Studio Alpha). And “fail” in that report means no measurable profit-and-loss impact within the study’s window, which is not the same as “didn’t work.”
What can be said with reasonable confidence is narrower, and more useful:
- Gartner predicted in July 2024 that at least 30% of generative AI projects would be abandoned after proof of concept by the end of 2025, citing poor data quality, inadequate risk controls, escalating costs, or unclear business value (Gartner press release). Note the word predicts. I could not find a published Gartner measurement confirming the outcome.
- Observers across the board agree that many firms struggle to move past proof of concept, even if they disagree on the number (GovInfoSecurity).
So treat “95%” as a headline, “30%” as a forecast, and the cases below as evidence.
The framework: five stages, four gates
Most published maturity models describe what an organization looks like at each level. That’s hard to act on. This version describes what you must be able to show to move up. I built it by comparing the stage structures used by several vendors and analysts (including the commonly cited five-stage patterns from Gartner-style models) and then pressure-testing it against the cases below. It is a synthesis, not an official standard.
| Stage | Name | What exists | What you can show |
|---|---|---|---|
| 1 | Sandbox | Individuals experimenting, demos, prompts in a chat window | A demo that works on a curated sample |
| 2 | Pilot | One team, one use case, real users, limited scope | Results on real data, with a baseline to compare against |
| 3 | Gated production | The system is live, but fenced: limited users or limited decisions | An owner, monitoring, and a rollback or human-handoff path |
| 4 | Operated product | Quality measured continuously, costs tracked, incidents handled | Quality and value numbers after launch, reviewed on a schedule |
| 5 | Scaled capability | New use cases reuse platform, evals and governance | A second and third use case shipped faster than the first |
And the four gates between them:

The gate questions (if you can’t answer “yes” with evidence, you haven’t passed):
- Sandbox → Pilot: Does it work on data as it really arrives, not a cleaned sample?
- Pilot → Gated production: Is there a named person accountable for its output, and a defined path when it’s wrong?
- Gated production → Operated product: Can you measure quality and business value now, in production, not just at launch?
- Operated product → Scaled capability: Could another team reuse the evaluation method, data pipeline, and governance without starting over?
Several stage guides make the same practical point: count a use case as production only when it has run for a period with someone accountable for its output (Classic Informatics), and a one-model “evidence test” (owner, documented pipeline, monitoring, impact KPI) is a harder standard than “we have pilots” (Kanerika). I’ve folded both ideas into the gates.
Now let’s see how real organizations fared.
Case 1: Zillow Offers — a model that was good at one job, asked to do another
Where it failed: between Stage 3 and 4. Gate 3: Is quality measured for the actual decision being made?
Zillow’s Zestimate is a machine-learning-assisted home value estimate. Zillow spent years improving it, including a multi-year data science competition that awarded a $1 million prize in 2019 (CNN Business, via KVIA). It then used the Zestimate as a starting point for buying homes itself through Zillow Offers.
The outcome, as reported in Zillow’s own Q3 2021 earnings, was a $304 million inventory write-down because it had bought homes at prices higher than its estimates of future selling prices. Zillow said it would wind down Zillow Offers and cut about 25% of its workforce (Inman). From April 2018 to September 2021, it bought about 27,000 homes and sold nearly 17,000 (CNN Business, via ABC17).
The detail that matters is what accuracy was being measured. Zillow’s spokesperson said the Zestimate’s median error was 1.9% for homes on the market, but 6.9% for off-market homes. The company later described the real challenge as forecasting the future price of inventory three to six months out in a market moving faster than ever.
That is a different task from estimating today’s value. A 1.9% error on a $500,000 house is nearly $10,000 per home, as CNN pointed out, and the errors compound across thousands of purchases.
The lesson: a model validated for display is not validated for decisions with money attached. Gate 3 asks whether quality has been measured against the specific decision. Zillow’s model was good enough for a website and, by the company’s own account, not good enough for forecasting prices months ahead.
Honest caveat: reporting attributes the failure to market volatility as well as modeling. Nobody outside Zillow can cleanly separate the two.
Case 2: MD Anderson and Watson — the pilot that never became a product
Where it failed: Stage 2 → 3. Gate 2: owner, scope, integration.
MD Anderson Cancer Center’s Oncology Expert Advisor, built with IBM Watson, was meant to support cancer treatment decisions. A University of Texas System audit found the project cost more than $62.1 million, and by September 2016 the system was not in clinical use and had not been piloted outside MD Anderson (PCWorld). IBM ended support for the pilot and demonstration systems on September 1, 2016.
What the audit actually documented is instructive, and it’s mostly not about the AI:
- The project’s focus changed multiple times, and it was initially trained on an electronic health record system that MD Anderson later replaced (Becker’s Hospital Review).
- It was never updated to integrate with the current system (PCWorld).
- Procurement rules were bypassed. Reporting on the audit cites roughly $39 million paid to IBM and over $21 million to PwC, almost all without board approval (Network World).
Be careful here: the audit examined management and procurement, and explicitly did not evaluate the system’s scientific capability (Becker’s). IBM said the advisor matched experts 90% of the time on lung cancer decision support and that the R&D project was a success (Engadget). Both statements can be true at once.
The lesson: a technically promising pilot can still die at Gate 2. Shifting scope, an unstable data source, no integration with where clinicians actually work, and no governance. Notice that none of those are model problems.
Case 3: Air Canada — production without an accountable owner for accuracy
Where it failed: Stage 3. Gate 2 again, but from the legal side: who answers for the output?
In November 2022, Jake Moffatt asked Air Canada’s website chatbot about bereavement fares after his grandmother died. The chatbot told him he could book at full price and claim a retroactive discount. He relied on it and was later refused (Fox Business).
On February 14, 2024, the British Columbia Civil Resolution Tribunal ruled for Moffatt in Moffatt v. Air Canada, 2024 BCCRT 149. It found Air Canada liable for negligent misrepresentation and ordered about C$812 in total, including damages, interest, and fees (Fox Business; American Bar Association).
The amount is small. The reasoning is not. Air Canada argued that the chatbot was effectively a separate entity responsible for its own actions, and the tribunal rejected that, finding the chatbot was part of the airline’s website and the airline was responsible for all information on it, whether from a static page or a chatbot. The tribunal also rejected the idea that the customer should have double-checked against another page on the site (ABA).
One more detail: the record does not establish what technology the chatbot used. The tribunal noted Air Canada did not provide information about its nature (AI Agent Incident Register).
The lesson: “the bot said it” is not a defense. At Gate 2, ask who is accountable for what the system tells customers, and what the process is for correcting it. This is a tribunal decision, not a court ruling, so its binding force elsewhere is limited. But it signals how a decision-maker reasoned.
Case 4: Klarna — measuring the wrong thing, then correcting in public
Where it stumbled: Stage 4. Gate 3: quality measured after launch.
Klarna is the most-quoted AI customer-service story, and also the most misreported, so the details matter.
In early 2024, Klarna said its AI assistant was handling about 2.3 million conversations in a month, with work equivalent to 700 customer service agents, and cut resolution time from 11 minutes to about two (TechInformed). Reports differ on whether the assistant took on 75% or about two-thirds of chats; I’ve seen both figures in credible coverage, so I’m not picking one.
In May 2025, CEO Sebastian Siemiatkowski told Bloomberg that cost had been too dominant an evaluation factor and that the result was lower quality. Klarna began a pilot to hire remote human customer-service agents (eMarketer; Entrepreneur). Klarna described this as a dual-track approach combining scalable AI with high-quality human support, “not a step back from automation” (Tech.co).
What I would not claim: that Klarna “abandoned AI” (it explicitly didn’t), or that the savings never materialized (eMarketer notes the company had estimated a $40 million profit improvement, but I found no independent confirmation of the final figure).
The lesson: speed and volume are easy to measure, so they dominate dashboards. Satisfaction, resolution quality, and escalation friction take more work. A Stage 4 system tracks the metrics that could prove it wrong, not just the ones that make it look good.
Case 5: Morgan Stanley — the success, and what it did differently
Where it passed: all four gates, at least by its own account.
Morgan Stanley’s wealth-management assistant (AI @ Morgan Stanley Assistant, built on OpenAI’s GPT-4) reports over 98% adoption among advisor teams, and document access rising from 20% to 80% (OpenAI case study).
An important caution: that case study is published by OpenAI, the vendor, so it naturally emphasizes success. A third-party review of it makes the same point (ZenML LLMOps Database). The adoption figure is believable partly because usage is easy to verify, but I’d treat the productivity claims as less proven than the adoption claim.
What stands out, per the case study, is process, not model choice:
- Morgan Stanley implemented an evaluation framework to test every AI use case before deployment, with expert feedback at each step (Gate 1 and Gate 3 in one move).
- It started with a narrow job, retrieving internal information, rather than open-ended advice.
- It expanded after the first use case worked, including to other divisions (Gate 4).
The lesson: evaluation before and during production is the one habit that shows up in the success and is conspicuously missing from the failures above.
The cases side by side
| Case | Stage reached | Gate missed or passed | Core issue | Evidence quality |
|---|---|---|---|---|
| Zillow Offers | 4-5 in ambition | Gate 3 | Model validated for display, used for forecasting | High (earnings, CNN) |
| MD Anderson / Watson | 2 | Gate 2 | Scope drift, integration, governance | High (state audit) |
| Air Canada | 3 | Gate 2 | No accountable owner for accuracy | High (tribunal decision) |
| Klarna | 4 | Gate 3 | Cost and volume over quality | Medium (CEO statements, press) |
| Morgan Stanley | 4-5 | Passed | Evals before deployment, narrow start | Medium (vendor-published) |
Score yourself: the weakest-link worksheet
Several maturity guides note that organizations rarely sit at the same level across all dimensions and that the weakest dimension sets the practical ceiling (Kanerika). That’s a good rule, so use it.
For one AI system you run (not your whole company), score each dimension from 1 to 5 using only evidence you could show an auditor.
| Dimension | 1 | 3 | 5 | Your score |
|---|---|---|---|---|
| Data fit | Curated sample | Real data, manual cleanup | Governed pipeline with lineage | |
| Ownership | “The team” | Named owner | Owner with budget and escalation path | |
| Evaluation | Eyeballing | Test set at launch | Continuous evals on live traffic | |
| Integration | Separate tool | Embedded in one workflow | Embedded, with fallback paths | |
| Risk and liability | Not discussed | Policy exists | Tested guardrails and a correction process | |
| Economics | Unknown | Estimated | Measured cost per outcome | |
| Adoption | Optional, low use | Moderate use | Users rely on it and say so |
Your real stage is your lowest score, not your average. If you scored 4s and 5s everywhere but a 1 on ownership, you are at Stage 1 or 2 for practical purposes. Self-assessments tend to count what has been deployed rather than what works reliably, and one analysis claims firms overestimate their level by one to two stages (Kanerika). I couldn’t trace that specific claim to underlying data, so use it as a prompt for humility, not a statistic.
What actually keeps pilots stuck
Pulling the cases and the stage guides together, these are the repeat offenders:
- Counting pilots as progress. Activity feels like capability. Three pilots with no owners are zero production systems.
- Funding the pilot, not the operation. Short pilot budgets with no run budget leave an orphan.
- Validating the wrong task. Zillow’s model answered “what is this house worth today,” while the business needed “what will it be worth in months.”
- No integration with where work happens. MD Anderson’s system fell out of step with the hospital’s own record system.
- Measuring what’s easy. Klarna’s story is a reminder that volume is a metric and quality is a judgment.
- Assuming someone else is liable. Air Canada tried; the tribunal disagreed.
A 90-day plan to move up one stage
Pick one system. Don’t try the whole company.
Days 1-15: Name and baseline. Write down who owns the system’s output. Write down what the process did before AI: cost, time, error rate. Without a baseline, you can’t claim improvement.
Days 16-45: Define the failure path. List the five worst things the system could say or do. For each, decide: what catches it, who is told, how it’s corrected. Test it on purpose.
Days 46-75: Build the live measurement. Choose 3-5 metrics, at least one of which could embarrass the project (customer satisfaction, escalation rate, correction rate). Review them on a fixed schedule.
Days 76-90: Run the gate review. Answer the four gate questions in writing, with evidence. If you can’t, you’ve found your next 90 days.
Frequently asked questions
What is an AI maturity model? A staged framework that rates how well an organization can build, deploy, govern, and scale AI. Most use five levels, from ad hoc experimentation to AI embedded across operations.
How long does it take to go from AI pilot to production? There is no reliable published benchmark, and I’d be wary of anyone quoting one. Timelines depend more on data readiness, integration, risk review, and ownership than on the model.
Why do AI pilots fail to reach production? Per the sources above: weak data foundations, no production pathway (monitoring, rollback), unclear ownership, short funding cycles, and unclear business value. The cases here add scope drift and measuring the wrong thing.
Is the “95% of AI pilots fail” statistic true? It’s from a single, contested study with limited methodological transparency. A safer claim is that many projects stall after proof of concept, as Gartner predicted for at least 30% of generative AI projects.
Should we build or buy? The MIT NANDA report is cited as finding that vendor partnerships succeed about 67% of the time versus 33% for internal builds (GovInfoSecurity). Given the methodology questions, treat it as a hypothesis to test, not a rule.
Sources and confidence
| Claim | Source | Confidence |
|---|---|---|
| Gartner 30% abandonment prediction | Gartner press release | High (primary), but it is a forecast |
| MIT NANDA 95% and its critiques | GovInfoSecurity, Fortune via Yahoo | Medium; I did not read the original report text |
| Zillow write-down and wind-down | Inman, CNN via ABC17 | High |
| MD Anderson $62.1M, audit findings | Becker’s, PCWorld, The Register | High (secondary reporting of a primary audit) |
| Moffatt v. Air Canada | ABA, Fox Business | High; I did not read the full decision text |
| Klarna 2024 claims and 2025 shift | eMarketer, Entrepreneur, Tech.co | Medium; relies on press reports of CEO statements, and sources disagree on 75% vs two-thirds |
| Morgan Stanley adoption | OpenAI case study | Medium-low; vendor-published |
| Roboflow 96% to 71% | Roboflow | Low-medium; vendor-published |
| Framework stages and gates | Author synthesis | This is an opinionated framework, not an industry standard |
If you spot an error, send a correction with a source, and we’ll fix it and log it.