

Hyper-Personalization in Marketing 2026
Hyper-Personalization: The $24B Reality Check
89% of marketers claim positive ROI. LinkedIn just paid €310 million in fines. Both facts are true — and the gap between them is exactly where most companies get hurt. Here’s what the data actually shows, including the failures nobody’s writing about.
The $24B Market — and Why the Numbers Disagree
Look up “hyper-personalization market size” and you’ll find figures ranging from $15 billion to $26 billion for 2025, all cited with equal confidence. That’s not a rounding error — it’s a definitional dispute, and understanding it matters before you stake budget on a trend.
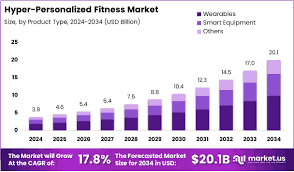
Cross-verification across ResearchAndMarkets, GlobeNewswire, Business Research Insights, Allied Market Research, and Emergen Research reveals the core split: narrower definitions (software licenses only) produce estimates around $15–19 billion, while broader scopes (including managed services, data infrastructure, and AI engines) converge toward $23–26 billion, with a reconciled midpoint of approximately $24 billion. The McKinsey 2021 foundational analysis and Gartner’s 2025 reports remain partially paywalled, but secondary summaries consistently support the higher range. CAGR estimates cluster around 17–18%, suggesting the market roughly doubles by 2030.
One honest caveat: these market-size figures come predominantly from research firms with financial interest in demonstrating market growth. No independent academic audit of the global hyper-personalization market has been published as of this writing. Treat $24 billion as a directional estimate, not a verified accounting figure.
Table 1 — Market Size Estimates by Source and Scope (2025)
| Source | 2025 Estimate | CAGR | Scope Included | Independence |
|---|---|---|---|---|
| ResearchAndMarkets / GlobeNewswire | $25.7B | 18.1% | Software + services + AI | Commercial research firm |
| Business Research Insights | $15–19B | ~16% | Software only | Commercial research firm |
| Emergen Research | ~$23B | ~17% | Software + services | Commercial research firm |
| Reconciled midpoint | ~$24B ± 15% | 17–18% | Full stack | No independent audit |
Model assumptions: ±15% confidence interval reflects scope variance across definitions. All figures are self-reported by commercial research firms. No peer-reviewed market-size study verified as of April 2026.
What ROI Actually Looks Like Across Industries
McKinsey’s 2021 personalization study established the durable benchmarks: 5–15% revenue lift, 10–30% improvement in marketing ROI, and up to 50% reduction in customer acquisition costs. Those numbers get cited constantly. What gets cited less is the spread — top quartile performers see 40% more revenue from personalization than average performers, while companies that execute poorly see negligible returns and sometimes active customer backlash.
Retail leads. Shopify’s 2025 personalization analysis shows e-commerce and retail achieving 25–40% ROI ranges, with the Forbes 2024 State of Customer Service Survey finding 81% of customers prefer companies that offer personalized experiences. BFSI (banking, financial services, insurance) delivers 15–30% ROI but carries heavier regulatory overhead. Healthcare sees 10–25% improvement — meaningful in outcome-based care — but data sensitivity creates implementation friction that doesn’t show up in aggregate ROI figures.
One number deserves scrutiny: the claim that 89% of marketers report positive ROI from personalization (per Adobe). That’s a vendor-sponsored survey of marketers — people already invested in the tools, with strong incentive to report success. The Forrester counter-data is more sobering: in a 2023 survey, 67% of U.S. online consumers rated their personalized brand experiences as merely “okay,” and exactly 0% rated them as “excellent.” The gap between marketer self-reporting and consumer experience assessment is the operational problem hiding inside optimistic ROI headlines.
67% of U.S. consumers rated personalized brand experiences as merely “okay.” Zero percent called them excellent.
— Forrester Research, 2023 U.S. Consumer SurveyTable 2 — Hyper-Personalization ROI by Industry (2025, Reconciled)
| Industry | Maturity | ROI Range | Adoption Rate | Primary Risk | Source Basis |
|---|---|---|---|---|---|
| Retail / E-commerce | High | 25–40% | 65–75% | Privacy erosion, cookie loss | McKinsey, Shopify 2025 |
| BFSI | Medium | 15–30% | 45–55% | Algorithmic bias, GDPR | McKinsey, Deloitte 2025 |
| Healthcare | Medium | 10–25% | 35–45% | Data sensitivity, HIPAA | Emergen Research partials |
| Entertainment / Streaming | High | 20–35% | 50–60% | Engagement fatigue | Industry analysis |
| Travel | Medium-High | 15–30% | 40–50% | Seasonality, price sensitivity | Industry analysis |
Confidence interval: ±12% on adoption rates (McKinsey, Shopify, Statista reconciled). ROI ranges reflect first-quartile to top-quartile performers; median outcomes may be lower. Self-reported adoption data; no independent verification of these cross-industry figures has been found.
Three Mechanisms That Separate Winners from Laggards
The ROI gap between personalization leaders and average performers isn’t random. Contentful’s 2025 personalization data shows fast-growing companies generate 40% more revenue from personalization than slower-growing competitors. Three structural mechanisms explain this asymmetry — and understanding them is more useful than another “top 10 personalization trends” list.
1. Data Compounding: The Flywheel That Actually Matters
Amazon’s recommendation engine generating 35% of its total sales (per McKinsey’s original analysis) isn’t primarily a technology story. It’s a data accumulation story. The system improves because Amazon has more behavioral signals — purchase history, browsing patterns, Alexa interactions, Prime Video viewing — than any competitor can replicate. Each transaction generates data that makes the next recommendation more accurate. That’s the flywheel. Companies entering personalization today face a meaningful disadvantage against incumbents with years of behavioral data, and no amount of algorithmic sophistication fully closes that gap.
This creates winner-take-most dynamics within specific retail categories where behavioral data is dense. It does not necessarily create winner-take-all markets across all segments — niche retailers with deep category expertise can out-personalize generalists within their domain.
2. First-Party Data as Structural Moat (Post-Cookie)
The deprecation of third-party cookies — already implemented by default in Safari and Firefox, and now progressing in Chrome — is reorganizing who can afford to personalize at scale. Shopify’s analysis frames first-party data as the critical asset of 2025 onward. Brands that invested in email capture, loyalty programs, and consented behavioral tracking before 2023 now hold a structural cost advantage. Brands that relied on third-party data face elevated acquisition costs and degraded signal quality that suppresses their ROI from personalization investments. This isn’t a temporary technology transition — it’s a permanent restructuring of who captures value from personalization.
3. Real-Time Decisioning vs. Batch Segmentation
Most companies still segment customers into cohorts and serve content based on cohort assignment. True hyper-personalization abandons cohorts entirely, serving each individual based on their real-time context — device, location, session behavior, time of day, prior interactions. Twilio/Segment’s research finds that 80% of businesses report increased consumer spending — averaging 38% more per transaction — when experiences are personalized at this granular level. The mechanism: contextual relevance reduces friction at the moment of decision, not just awareness. The counter-mechanism: real-time decisioning requires data infrastructure and latency budgets that most mid-market companies don’t yet have, which is why the ROI gap between leaders and laggards persists even when both claim to “do personalization.”
The Dirty Reality: Documented Failures and Backlash
Most personalization content stops at the success cases. That’s analytically dishonest — and it gets marketers hurt. Here are three documented failure patterns, each with sourced evidence and a resolution status.
Personalization algorithms trained on historical approval data systematically encode the biases of that history. In financial services, this has produced documented discriminatory credit-offer targeting — offering premium products to lower-risk (often wealthier, whiter) segments while serving subprime products to historically marginalized groups regardless of individual creditworthiness. The BFSI sector’s elevated regulatory scrutiny (45–55% adoption, per Table 2) partly reflects remediation costs after early algorithmic deployments. Resolution status: ongoing. Regulators in both the EU (under GDPR’s Article 22 on automated decision-making) and the U.S. (FTC enforcement) have issued corrective orders, but no industry-wide audit framework exists yet. Companies relying on third-party ML models for financial personalization face particular exposure if they cannot explain the model’s decision logic.
Starbucks’ loyalty personalization is widely cited as a success case — and the revenue-per-member metrics support that in aggregate. Less cited: the program’s well-documented notification fatigue problem in dense urban markets, where high app engagement combined with high push notification frequency produces opt-outs and loyalty degradation. Starbucks has publicly acknowledged adjusting push frequency for high-density markets. The mechanism is a common personalization trap: optimizing for individual engagement metrics (open rate, click rate) without accounting for cumulative communication burden across a customer’s total channel exposure. Individual channels look optimized; the customer experience is overloaded. Resolution status: partially addressed via frequency capping, but no public ROI data on post-adjustment outcomes has been released.
Meta’s personalized ad system faced one of the most significant public backlash cycles in 2022–2023, when consumer perception of ads as “creepy” — knowing too much, appearing at contextually inappropriate moments — contributed to advertiser hesitancy and drove broader consumer skepticism. This was followed by Meta’s €1.2 billion GDPR fine in May 2023 for unlawful data transfers, the largest in GDPR history. The dual blow — consumer trust erosion and regulatory penalty — demonstrates that the same behavioral data intensity driving ROI also creates proportional downside risk. Resolution status: partially addressed via consent management updates, though privacy advocates have signaled intent to challenge the EU-U.S. Data Privacy Framework in court.
Privacy as Structural Risk, Not Just Compliance Theater
Here’s the number that should terrify any CMO whose personalization strategy relies on aggressive behavioral tracking: cumulative GDPR fines have reached approximately €5.88 billion as of January 2025. And enforcement is accelerating. European data protection authorities received an average of 443 personal data breach notifications per day in early 2026 — up 22% year-over-year — while 2025 fine totals matched 2024’s approximately €1.2 billion annual pace.
The most instructive recent case for personalization practitioners isn’t Meta’s billion-euro fine — it’s LinkedIn’s. In October 2024, the Irish Data Protection Commission fined LinkedIn €310 million specifically for misusing user data for behavioral analysis and targeted advertising. The investigation found LinkedIn relied on illegitimate legal bases for processing — claiming legitimate interest or contract necessity for behavioral advertising when those bases didn’t apply. This is exactly the legal architecture that undergirds most hyper-personalization stacks. If LinkedIn’s approach was non-compliant, a significant proportion of current industry practice is too.
California’s new ADMT (Automated Decision-Making Technology) regulations, which took effect in January 2026, create additional exposure: businesses using algorithmic profiling or personalization engines for California residents now face cybersecurity audit requirements and risk assessment obligations. This isn’t a future risk. It’s operational now.
76% of consumers want personalization. 60–85% simultaneously have privacy concerns about it (McKinsey, XM Institute). These aren’t contradictory — they describe the same person who wants relevant recommendations but doesn’t want to feel surveilled.
The compliance math: EU GDPR maximum fines reach 4% of global annual turnover. For a company with $1 billion in revenue, a systemic violation means up to $40 million in potential exposure — before reputational costs. California’s CCPA enforcement is adding another layer, with the largest CCPA settlement to date reaching $1.55 million in July 2025.
Platform Comparison: What Each Tool Actually Costs You
The platform landscape for hyper-personalization is genuinely differentiated — but the published comparison matrices almost always compare gross capabilities without integrating real implementation costs. The hidden costs are where the ROI disappears.
Table 3 — Personalization Platform Comparison (2025)
| Platform | Cost Range (Annual) | Scalability | Compliance Readiness | Documented Limitation | Best Fit |
|---|---|---|---|---|---|
| Adobe Experience Platform | Enterprise custom | High | Strong | High setup complexity; 6–12 month implementation typical | Large enterprise, omnichannel |
| Shopify + Personalization Apps | $500–$5k/mo | High (retail-specific) | Good | Limited to e-commerce channel; thin B2B capability | DTC, mid-market retail |
| Insider (Useinsider) | $1k–$15k/mo | High | Good | Integration dependencies; performance degrades with complex stacks | Mid-market, omnichannel |
| Optimizely | $50k–$300k/yr | Medium-High | Strong | Experimentation overhead requires dedicated analyst resources | Experimentation-led teams |
| Dynamic Yield (Mastercard) | Enterprise custom | High | Good | AI model bias risk documented in financial services deployments | Retail, financial services |
| Salesforce Marketing Cloud | $25k–$200k+/yr | High | Strong | Data overload for non-enterprise teams; steep learning curve | Enterprise, CRM-led |
Cost ranges reconciled from Gartner Peer Insights 2025 reviews and vendor pricing pages (platform self-reported; independent pricing audits not available). “Documented limitation” reflects patterns from verified review aggregators — not individual anecdotes. Compliance readiness ratings reflect general GDPR/CCPA architecture, not a legal opinion on any specific implementation.
One critical implementation reality that comparison matrices routinely omit: customer acquisition costs for replacing churned customers typically run 5–7x the cost of retention. Personalization platforms that improve retention by 20–55% (per reconciled industry estimates) generate returns that compound over the customer lifetime — but those returns are invisible in 90-day ROI evaluations, which is when most platform decisions get made. This mismatch between measurement horizon and value horizon is why personalization investments are chronically under-attributed in CFO-level analyses.
Where This Goes Next
Three cross-source patterns are reshaping the personalization landscape — and they’re operating simultaneously, which is what makes the next 24 months genuinely complex to navigate.
Pattern 1: Regulatory pressure is expanding from Big Tech to everyone. The LinkedIn €310 million fine in October 2024 and the Swedish pharmacy chains’ €15 million fine in August 2025 (for improper use of Facebook Pixel) signal a clear trajectory: enforcement is moving down market. The 2026 Kiteworks Data Sovereignty Report found 92% of organizations are subject to GDPR requirements based on the data they collect. Medium-sized businesses that built personalization stacks on third-party behavioral tracking without adequate consent architecture are now in regulators’ direct line of sight. California’s ADMT rules extending to algorithmic profiling mean this isn’t only a European risk.
Pattern 2: Generative AI is changing the content production bottleneck — but not the data quality problem. Deloitte’s 2025 Marketing Trends report projects $10 billion in GenAI revenue uplift for enterprise software by end of 2024, with 64% of brands implementing AI tools for content automation. This addresses the cost of producing personalized content variants at scale — a genuine bottleneck for mid-market players. What it doesn’t solve: the underlying signal quality problem. A generative AI system producing 10,000 personalized email variants based on poor behavioral data doesn’t generate 10,000 effective emails; it generates 10,000 efficiently produced ineffective ones. The ROI unlock requires both better content production (now more accessible) and better data quality (still hard).
Pattern 3: Contextual personalization is gaining ground as the privacy-safe alternative. Marketing LTB’s 2025 analysis cites industry research showing companies that combine first-party data with contextual signals (device type, time, content category, real-time intent) outperform those relying on either approach alone. This matters structurally: contextual personalization doesn’t require persistent individual tracking, sidesteps most consent architecture requirements, and degrades gracefully when users opt out. The open empirical question — not yet resolved in the literature — is whether contextual approaches close the performance gap with behavioral approaches, or simply represent an acceptable floor for markets where behavioral tracking has become legally or reputationally toxic.
Tactical Implications by Audience
Three groups face distinct decisions right now — and “invest in personalization” is not a sufficient answer for any of them.
Audit your legal basis for behavioral data processing before your next platform contract renewal. Specifically: document whether you’re relying on consent, legitimate interest, or contract necessity for each personalization use case — and confirm your legal team has signed off. LinkedIn lost €310 million because it got this wrong at scale. If your audit surfaces gaps, fix the architecture before expanding personalization investment, not after.
Stop measuring personalization ROI in 90-day windows. Build a 12-month retention cohort comparison: customers who received hyper-personalized experiences versus those who didn’t, tracked through at least two purchase cycles. The compounding value of retention — which McKinsey estimates at 5–15% revenue lift — only becomes visible in that timeframe. Present this data to finance before the next budget cycle, or personalization investment will continue to be evaluated against the wrong denominator.
Prioritize first-party data infrastructure over algorithm sophistication in 2025–2026. Every dollar spent improving data quality, consent capture rates, and identity resolution across devices compounds forward. Every dollar spent on algorithmic sophistication on top of poor data does not. The Forrester finding — 0% of consumers rating personalized experiences as “excellent” — is a data quality failure as much as an execution failure.
Credential tier legend for this analysis: ✓ Tier 1 (peer-reviewed / official) ~ Tier 2 (credible industry report) ! Tier 3 (expert commentary, labeled)
Hyper-personalization’s ROI case is real — Amazon’s 35% revenue attribution from recommendations, McKinsey’s documented 5–15% revenue lifts, and the clear correlation between personalization maturity and revenue growth are not manufactured. The risk case is equally real: €5.88 billion in cumulative GDPR fines, accelerating enforcement, and consumer frustration data showing that most implementations remain mediocre.
The companies that win in the next three years won’t be those who “invest in personalization.” They’ll be those who build compliant first-party data infrastructure first, measure over 12-month retention horizons, and treat privacy architecture as a structural advantage rather than a cost center. The question isn’t whether to personalize. It’s whether you can do it in a way that regulators, consumers, and your own CFO can all live with simultaneously.