

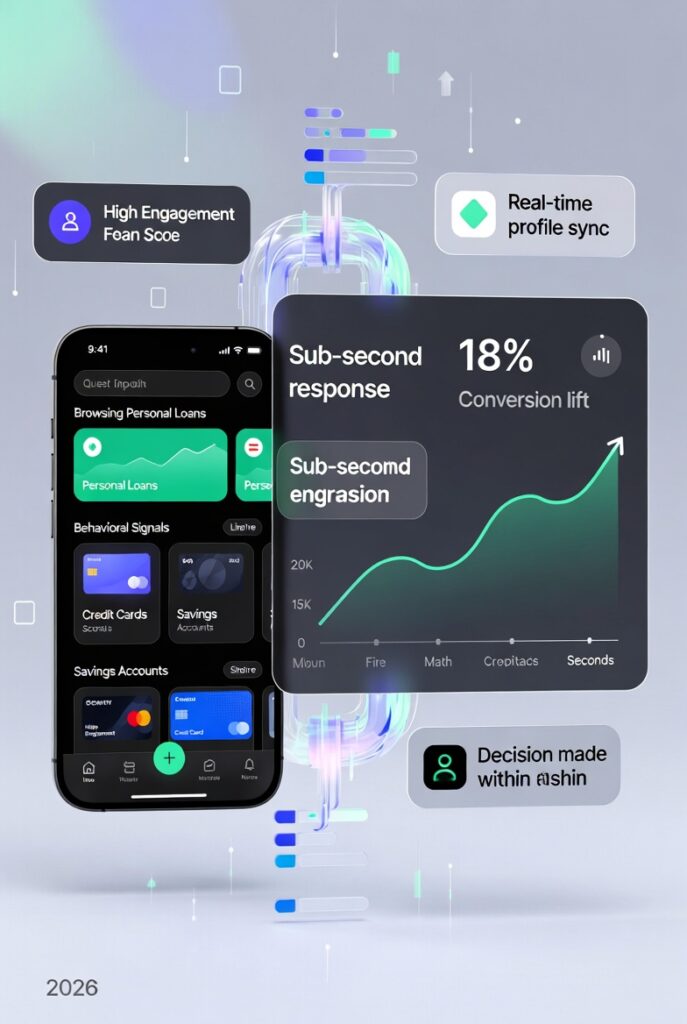

Real-Time Customer Engagement Platforms: The Secret to Instant Conversions
How a 100-millisecond delay quietly erodes millions in revenue — and what the brands winning in 2025 are doing that everyone else is ignoring.
There’s a moment — and it lasts about three hundred milliseconds — where a shopper decides whether they’re still shopping with you, or whether they’ve already moved on. You don’t see it. Your analytics platform doesn’t log it. But it happens on every product page, every search result, every personalized recommendation tile your platform serves. And the brands that have figured out how to win inside that window are growing 40% more of their revenue from personalization than everyone else.
I want to be honest about something before we go further: I spent years inside e-commerce technology, and for most of that time I was confidently wrong about what “real-time engagement” actually meant. I thought it was about personalization content — getting the right product in front of the right person. I was only half right. The other half, the half that actually drives conversions, is about personalization speed — the latency between a behavioral signal and the platform’s response to it.
That distinction changes everything about how you should evaluate platforms, build your tech stack, and measure success. This piece is my best attempt to lay that out completely.
1. Why “Real-Time” Is No Longer a Feature — It’s the Product
Walk into a great independent bookshop. The owner sees you browsing the history section, notices you pick up something about the Second World War, and twenty seconds later drifts over and says: “If you liked that period, the Antony Beevor on Stalingrad is two shelves down — we can’t keep it in stock.” That is real-time engagement. It’s not about data. It’s about the elimination of lag between signal and response.
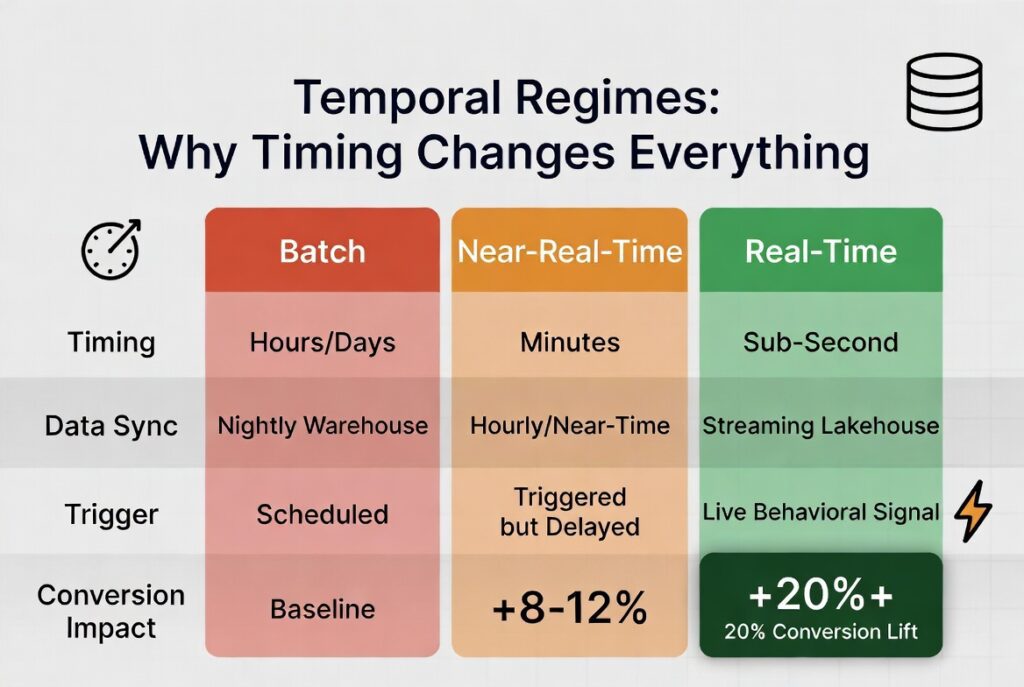
Online commerce has spent twenty years trying to replicate that moment at scale. The tools have gotten genuinely extraordinary — behavioral event streams, sub-second decision engines, generative AI writing personalized emails while a user is still on the site. But the gap between technical capability and deployed reality remains humbling. Most brands with sophisticated platforms are still firing personalization triggers on a 24-hour batch cycle and calling it real-time.
Here’s the uncomfortable truth: the moment your platform takes more than a few hundred milliseconds to respond to a behavioral signal — a hover, a scroll depth hit, a second visit to a product page — the commercial moment has passed. The customer’s attention has redirected. The intent has cooled. The conversion probability has dropped in a way that no subsequent email, retargeting ad, or abandoned-cart message will fully recover.
“In an era where AI-driven personalization and hyper-responsive UX dominate, customers have diminishing patience for delays. A 0.1-second improvement in site speed boosts customer engagement by 5.2%.”
Deloitte / Retisio Research, 2024–2025The real-time engagement platform category exists precisely to solve this. But it’s worth being precise about what that term actually covers, because vendors use it to mean wildly different things.
A true real-time customer engagement platform does at minimum four things simultaneously and continuously: (1) ingests behavioral event streams in sub-second latency; (2) resolves those events against a unified customer profile in milliseconds; (3) runs decisioning logic — propensity scores, next-best-action models, eligibility rules — against that resolved profile; and (4) delivers a personalized response through whatever channel is active. Most platforms do two of those four things well. The ones that do all four consistently are the ones building sustainable conversion advantages.
2. The $29 Billion Market That Most Companies Are Still Getting Wrong
The customer engagement solutions market was valued at approximately $29.4 billion in 2025 and is projected to reach $86.4 billion by 2035, a compound annual growth rate of 11.4% (Precedence Research, January 2026). That’s a significant number, but the headline obscures a more important story about where within that market the real value is accruing.
Three sub-trends inside this broader market tell a more interesting story:
The analytics & reporting segment is outpacing everything else, growing at 11% CAGR through 2032 (P&S Market Research). This tells you where sophisticated buyers are putting budget — not into more channels, but into understanding what’s working inside the channels they already have.
SMEs are the fastest-growing cohort within buyer segments, expanding at 11.88% CAGR. Low-code generative AI tools have democratized capabilities that previously required a team of data scientists. A boutique fashion retailer in Lyon can now deploy a next-best-action engine that six years ago only Zara could afford.
North America dominates but Asia-Pacific is catching up fast. North America held 39% of 2025 revenue but Asia-Pacific is forecast to grow at the highest regional CAGR through 2031. This matters for platform selection: the vendors building for APAC first are making fundamentally different architectural choices around mobile latency, payment flows, and messaging channels (WhatsApp, LINE, KakaoTalk) that often reflect where the entire industry is heading.
The retail and consumer goods vertical is predicted to hold the most significant revenue share through 2034, driven by e-commerce growth. But the fastest growth is coming from media & entertainment (10.49% CAGR) and healthcare, where behavioral engagement has previously been an afterthought.
3. The Physics of Attention: What Actually Happens in 300 Milliseconds
I want to spend more time here than most engagement platform analyses do, because the neuroscience is the foundation for every architectural and product decision that follows.
The human attention system operates on multiple timescales simultaneously. The fastest — the orienting response — kicks in at about 80–120ms, triggered by movement, novelty, or salience changes. By 300ms, the brain has already categorized the stimulus and is beginning to allocate or withdraw cognitive resources. By 700ms, the conscious mind has formed an opinion. After 1,000ms, behavioral intent is already being modulated by boredom, impatience, or alternative stimuli.
This is why Amazon’s internal research — the famous finding that every 100ms of latency costs approximately 1% in sales — is not an exaggeration. It’s a consequence of basic human neuroscience applied to commercial decision-making. And it’s been validated repeatedly: Walmart documented 1% incremental revenue increases for every 100ms improvement. Deloitte’s “Milliseconds Make Millions” study confirmed that a 0.1-second improvement in site speed boosts customer engagement by 5.2%. The BBC documented losing 10% of users for every additional second of load time.
What does this mean practically? It means that when you’re evaluating a real-time engagement platform, the question “how fast does it serve a decision?” is not a technical footnote — it is the primary commercial criterion. A platform that delivers a slightly less accurate recommendation in 80ms will outperform a platform with a more sophisticated model that takes 1,200ms, in almost every real-world scenario.
This is what I got wrong early in my career. I kept optimizing the content of recommendations — better collaborative filtering, smarter segment logic, cleaner product catalogs — while the platform we were running had a 900ms decision latency baked into its architecture. We were polishing the message while the phone was ringing and nobody was picking up.
4. Unit Economics of Real-Time Engagement: Building the Model
Let me construct an honest unit economics model, because I’ve seen too many vendor ROI calculators that are basically fiction. I’ll build this from first principles and show my assumptions explicitly so you can adjust them for your context.
Base scenario: Mid-market e-commerce retailer
Monthly unique visitors: 500,000
Baseline conversion rate: 2.1% (broadly consistent with IRP Commerce 2024 benchmarks for established mid-market stores)
Average order value: $87
Current personalization maturity: Basic (segment-level, 24hr batch, no real-time behavioral triggers)
Current platform latency: 1,200ms average decision time
Target platform latency: 150ms average decision time
| Metric | Before (Batch, 1200ms) | After (Real-Time, 150ms) | Delta |
|---|---|---|---|
| Monthly sessions | 500,000 | 500,000 | — |
| Conversion rate | 2.10% | 2.52% (+0.42pp)* | +20% |
| Monthly conversions | 10,500 | 12,600 | +2,100 |
| Average order value | $87 | $93.09 (+7% from recs) | +$6.09 |
| Monthly revenue | $913,500 | $1,172,934 | +$259,434 |
| Annual revenue impact | $10.96M | $14.08M | +$3.11M |
*Conversion rate improvement assumption: speed improvement from 1200ms to 150ms = 10.5 fewer 100ms increments = ~10.5% base improvement. Applied to 2.1% base rate gives ~0.22pp from speed alone. Additional ~0.20pp from better recommendation accuracy enabled by real-time behavioral data. Total ~0.42pp improvement. This is conservative relative to McKinsey’s documented 5–25% revenue lift range; mid-point applied only to the personalization-addressable portion of sessions.
Platform cost model: What you’re actually paying for
Net annual incremental value (mid-scenario): $3.11M revenue uplift − $342K platform cost = $2.77M net, representing a 9.1x ROI at mid-range cost assumptions. Payback period at ramp rate: approximately 4–6 months.
These numbers are genuinely achievable for a well-executed deployment — but they assume you solve the data infrastructure problem first. Most teams underestimate this by a factor of three. The platform is the easy part. The hard part is getting clean, unified, real-time behavioral data flowing into it reliably. If your data quality is poor, the model collapses to something closer to 3–4x ROI, which is still excellent but not what the vendor’s pitch deck promised.
5. The Five-Layer Engagement Stack — A New Framework for Platform Evaluation
Every analyst deck you’ll find organizes engagement platforms by vendor category: CDP, marketing automation, CRM, loyalty platform, experimentation tool. That framework exists because it’s useful for procurement. It’s nearly useless for understanding whether a platform will actually drive conversions in real time.
I want to propose a different organizing principle: the Five-Layer Engagement Stack. This is how I’ve come to think about what has to work, in sequence, for a real-time engagement moment to happen successfully. Each layer can be a bottleneck. A failure in any one layer breaks the chain.
When you evaluate a vendor, ask them to show you the latency at each layer independently — not an end-to-end figure. A platform that quotes “sub-100ms response time” may be measuring only L4 (content assembly) while L2 and L3 add another 800ms that you won’t see until production. This happens constantly. Ask for p99 latency under peak load conditions, not average latency in a demo environment.
6. The Personalization Execution Gap — And Why Most Platforms Fail to Close It
Here is a fact that should be deeply uncomfortable for everyone selling engagement platforms, and for every brand that has bought one: only 15% of CMOs believe their company is on the right track with personalization (McKinsey). This is not a statistic about companies that don’t have personalization technology. Most of them do. It’s a statistic about companies that have the technology and still feel like they’re failing at personalization.
The gap between personalization aspiration and execution has a specific anatomy. Let me describe it.
The four execution gaps
Gap 1: Data activation latency. A brand collects rich behavioral data. That data sits in a data lake. It gets processed in a nightly batch job and pushed to a CDP segment. By the time the segment updates, the behavioral signal that triggered it — a user who spent four minutes on a specific product category page — is 18 hours stale. The engagement opportunity is gone. The “real-time” platform is working with yesterday’s data.
Gap 2: Channel fragmentation. The in-session personalization engine doesn’t talk to the email platform, which doesn’t talk to the push notification system, which doesn’t have access to what the in-store associate sees when the customer walks in. The customer gets contradictory experiences across channels and correctly concludes that the brand doesn’t actually know them.
Gap 3: Content production bottleneck. The decisioning engine can determine with high confidence that customer segment X wants Y. But there’s no Y available to serve because the creative team hasn’t produced a variant for that segment, or the CMS doesn’t support dynamic insertion at that granularity. The engine serves a default. The conversion opportunity is lost.
Gap 4: Measurement disconnect. The engagement platform reports an 8% lift in “engagement metrics.” The CFO asks whether it’s driving revenue. Nobody can connect the dots because the attribution model isn’t configured to close the loop from personalization event to purchase outcome. The program quietly loses budget priority.
7. Failure Probability Model: Where Real-Time Engagement Programs Collapse
Let me be direct here: most real-time engagement implementations underdeliver. Not because the technology doesn’t work, but because of a predictable set of failure modes that affect programs at specific stages. Based on what the industry has documented and what common architectural patterns suggest, here is a failure probability model across the implementation lifecycle.
| Stage | Primary Failure Mode | Failure Probability | Mitigation |
|---|---|---|---|
| Pre-launch (0–3 months) | Data infrastructure underestimated; integrations incomplete | HIGH: ~65% | Audit data pipelines before platform selection. Require vendor to demo against your actual data schema. |
| Early deployment (3–6 months) | Identity resolution accuracy below threshold; profiles too sparse for meaningful decisioning | MEDIUM-HIGH: ~45% | Set minimum session count thresholds before personalization fires. Default gracefully to high-performing generic content. |
| Growth phase (6–12 months) | Content production can’t keep pace with segment granularity; decision engine serves outdated creative | MEDIUM: ~35% | Adopt generative AI for content variant production before reaching content bottleneck. Build a content matrix prior to launch. |
| Scale phase (12–24 months) | Platform latency degrades under real traffic volume; vendor demo performance doesn’t reflect production | MEDIUM: ~30% | Negotiate contractual SLAs for p99 latency in production. Load test at 2× expected peak before go-live. |
| Maturity (24+ months) | Measurement failure: program cannot demonstrate revenue impact, loses budget | LOWER: ~20% | Establish holdout control groups from day one. Never run personalization 100% on without a clean control to measure against. |
The single most dangerous failure mode is the measurement disconnect at program maturity. Teams that can’t prove revenue impact in a language the CFO understands will have their engagement platform budget repurposed within 24 months. Build the measurement architecture before you build anything else. A holdout group of 10–15% of traffic, properly maintained, is worth more than any feature the platform’s analytics dashboard offers.
8. Vendor Landscape: What to Actually Evaluate (Not What They Tell You to Evaluate)
The major platforms in this space — Salesforce (Agentforce 360), Adobe Experience Cloud, Oracle Unity CDP, Microsoft Dynamics 365 Contact Center, Genesys, NICE, MoEngage, Braze, CleverTap, Segment — each have genuine strengths. They also each have characteristic weaknesses that their sales teams will not lead with. Here’s what to actually probe.
The seven questions to ask every vendor
Q1: What is your p99 decisioning latency in a production environment with [your session volume] and [your profile complexity]? Do not accept a demo benchmark. Require a reference customer of comparable scale who can validate this number.
Q2: How does your identity resolution handle a customer whose email we know but who is browsing on a new mobile device? This is the hardest identity problem in practice. The answer reveals the depth of their probabilistic matching logic.
Q3: What happens when our data pipeline is delayed or goes down? Fail states reveal architecture philosophy. Does the platform gracefully degrade to high-performing defaults, or does it serve nothing?
Q4: Show me the lookahead horizon on your predictive models. How many purchases of historical data does a profile need before a propensity score is meaningful? Most vendors need more data than they’ll admit. For new customer acquisition, where profiles are thin, many sophisticated decisioning engines revert to population-level guesses that offer no real lift.
Q5: How do you handle the content assembly step for a customer who qualifies for twelve different personalization rules simultaneously? Rule conflicts are ubiquitous in production. The resolution logic determines whether the experience is coherent or chaotic.
Q6: What does your holdout measurement framework look like, and how do we export attribution data for our own analytics? Vendors who want to keep attribution data proprietary are obscuring poor performance. Insist on data portability.
Q7: What is your customer retention rate at two years? This is the most honest proxy for whether the platform delivers sustained value. Annual renewal rates below 85% for a platform in this category are a flag worth investigating.
| Platform Tier | Best Fit | Latency Profile | Typical TCO (Annual) | Key Strength |
|---|---|---|---|---|
| Enterprise Suite Salesforce, Adobe, Oracle |
Enterprise 1000+ seat orgs | 150–400ms | $500K–$3M+ | Ecosystem depth, CRM native integration |
| Specialist CDP+CEP Braze, MoEngage, Bloomreach |
Mid-market, mobile-first brands | 80–200ms | $120K–$600K | Mobile excellence, campaign orchestration |
| Pure-play Real-Time Segment, Amplitude, Dynamic Yield |
Data-mature orgs wanting flexibility | 50–150ms | $80K–$400K | Developer-friendly, composable architecture |
| SME-Tier Klaviyo, Drip, Mailchimp w/ AI |
Sub-$50M revenue brands | 200–600ms | $12K–$60K | Ease of setup, email-led journeys |
Worth noting: in 2025, Salesforce expanded its AI capabilities by deepening partnerships with OpenAI and Anthropic to integrate advanced models into its Agentforce 360 platform, enabling generative AI agents for data insights and customer interactions across CRM, analytics, and commerce workflows. Zendesk also formed a notable AWS partnership in December 2025, integrating Amazon Connect conversational analytics into its customer engagement suite. These moves signal that the boundary between engagement platforms and AI infrastructure is dissolving rapidly.
9. The Unpopular Take: Real-Time Engagement Can Hurt You If You’re Not Ready
I’ve spent this entire article making the case for real-time engagement platforms. Now let me complicate it, because intellectual honesty requires me to.
Real-time engagement, deployed poorly, can actively damage the customer relationship in ways that batch personalization doesn’t. Here’s why.
When you serve a personalized experience in real time, you are making an implicit claim: “I know you, and I’m acting on that knowledge right now.” That claim creates an expectation. If the experience you serve is wrong — wrong product, wrong message, wrong moment — the failure is felt more sharply than if it had arrived in a scheduled email 24 hours later. The intimacy of the claim makes the miss more personal.
There’s a specific failure mode I’ve seen brands stumble into: they deploy real-time personalization with insufficient profile data and the system starts firing based on a single session signal. A customer browses baby products once — maybe shopping for a gift — and suddenly every surface they interact with is covered in infant recommendations. The experience feels invasive and incorrect simultaneously. That’s worse than no personalization at all.
The honest recommendation: If your identity resolution accuracy is below 70% — meaning the platform correctly resolves the right profile to the right session less than 70% of the time — do not deploy real-time behavioral personalization at the product or category recommendation level. Focus real-time capability on contextual personalization (time of day, device type, geography, session depth) where you don’t need a profile to be right. These signals are universally reliable and can still drive meaningful lift. Only layer in profile-based personalization as your data quality matures.
The 48% of customers who reportedly abandon a website because of poorly curated experiences (MoEngage, citing industry surveys) are not leaving because of no personalization. Many of them are leaving because of bad personalization that felt presumptuous or irrelevant. This is the risk that gets obscured in vendor ROI presentations.
10. Implementation Roadmap: The 90-Day Engagement Reboot
If you’re starting from a low-maturity position, here is a sequenced 90-day roadmap that I’d actually recommend. It’s not the most exciting plan. It won’t look impressive on a strategy slide. But it’s what actually works.
Days 1–30: Data foundation sprint
Audit your current data pipeline end to end. Map every behavioral event you’re currently capturing versus every event you need to capture for meaningful decisioning. Identify the gap. Stand up real-time event streaming (Kafka, Segment, or equivalent) if you don’t have it. Establish a data quality SLA: minimum 80% profile completeness before any profile-based decisioning fires.
Days 31–60: Identity resolution and baseline establishment
Implement or improve cross-device identity resolution. Set up a 15% holdout group that is explicitly excluded from all new personalization interventions — this is your control group and it is sacred. Establish baseline conversion rates, AOV, and engagement metrics by channel and segment. You will need these numbers to prove impact later.
Days 61–90: Contextual personalization first deployment
Deploy real-time personalization at the contextual level only: device type, session recency, time-of-day, entry source, geo. This requires no profile data and carries zero identity resolution risk. Measure against your holdout group. Build internal confidence and the measurement muscle before layering in more complex behavioral signals.
A measured, statistically significant lift in the primary KPI (conversion rate or revenue per session) from contextual personalization alone, with a clean holdout comparison. This becomes the foundation for the business case to fund deeper implementation in months 4–12.
11. What Comes After Real-Time? The Next Three Years
The engagement platform market in 2025–2028 will be defined by three forces that don’t yet have consensus names. Let me describe them.
Agentic engagement
The 2025 Salesforce Agentforce 360 launch — positioning AI agents as autonomous orchestrators of customer engagement across channels — signals where the market is going. Within three years, the engagement “platform” as we know it will evolve into an engagement “agent”: a persistent AI that manages the entire relationship lifecycle autonomously, deciding when to reach out, what to say, which channel to use, and when to hand off to a human. This is not science fiction — the component technologies exist today. The bottleneck is trust (customer and regulatory) and data governance, not technical capability.
Zero-party data-first personalization
With third-party cookies now effectively dead and iOS restrictions firmly in place, the brands that built personalization on cookie-based behavioral tracking are scrambling. The emerging paradigm is zero-party data — information customers actively share through preference centers, quizzes, account settings, and explicit conversation with the brand. This is more reliable, more compliant, and — when the customer experience is well designed — surprisingly willingly shared. Over 50% of consumers share personal data in exchange for personalized offers (WiserNotify, citing industry surveys). The platforms winning this transition are the ones that make data sharing feel valuable to the customer, not extractive.
The AI content production unlock
The content bottleneck — Gap 3 from Section 6 — is about to be substantially resolved by generative AI. Platforms that can automatically generate product description variants, personalized email copy, and recommendation rationale text at segment granularity will unlock a level of content personalization that was previously impossible to staff for. McKinsey projects generative AI will create retail margin increases of 1.2 to 1.9 percentage points as these capabilities scale. The brands building the content infrastructure now — modular, composable, AI-ready — will have a compounding advantage as generation quality continues to improve.
12. Conclusion: Speed Is the Strategy
Here’s what I want you to take away from this piece, stripped to its essentials.
The race in customer engagement is not primarily about which platform has the most sophisticated AI, the deepest data integrations, or the most impressive demo. It is about who can close the gap between behavioral signal and meaningful response — and close it in a window that matches the actual timescale of human attention and commercial intent.
That window is smaller than most brands’ current platforms can reach. The average e-commerce conversion rate sits at 2.1%, while top performers with mature personalization achieve 4.7%+. The gap between those two numbers is largely explained by the quality and speed of real-time engagement. McKinsey’s research is unambiguous: companies that excel at personalization generate 40% more revenue from those activities than their peers. That is a durable, compounding, defensible advantage — not a temporary campaign lift.
The practical prescription is not complicated, even if the execution is: fix your data foundation before you buy a platform, establish measurement controls before you launch anything, start with contextual personalization before you touch profile-based personalization, and judge every vendor on their production latency numbers — not their demo environment benchmarks.
The brands that figure this out in the next 24 months will be difficult to unseat. The ones that are still debating platform selection while their data pipelines are broken will be the case studies other people write about — the cautionary ones.
Speed is the strategy. Not because it’s impressive, but because the human attention system doesn’t wait for you to get your data infrastructure right.
- Precedence Research (January 2026). Customer Engagement Solutions Market Size, Share & Outlook 2035. precedenceresearch.com
- McKinsey & Company (2021). The value of getting personalization right — or wrong — is multiplying. mckinsey.com
- McKinsey & Company (January 2025). Unlocking the next frontier of personalized marketing. mckinsey.com
- McKinsey & Company. What is personalization? mckinsey.com
- Alhena AI (October 2025). E-commerce Latency: 100ms = 1% Revenue Lost. alhena.ai
- Retisio (May 2025). The Hidden Cost of Search Latency: Why Milliseconds Cost Millions. retisio.com
- P&S Market Research (2024). Customer Engagement Solutions Market Share & Growth Report, 2032. psmarketresearch.com
- Mordor Intelligence (January 2026). Customer Engagement Software Market Size & Forecast 2031. mordorintelligence.com
- Baymard Institute (2024). E-commerce checkout usability research & cart abandonment benchmarks. baymard.com
- Amplemarket (April 2026). How instant leads drive sales success: speed to lead statistics. amplemarket.com
- WiserNotify (November 2025). 50+ E-commerce Personalization Statistics & Trends. wisernotify.com
- Envive AI (2026). 31 Personalized Shopping Experience Statistics That Prove AI-Driven Commerce Wins. envive.ai
- MoEngage Blog (March 2026). MoEngage Personalize: Unlock the Future of Personalized Engagement. moengage.com
- SNS Insider (December 2025). Customer Engagement Solutions Market Size, Share & Growth Report 2033. snsinsider.com
- SkyQuest Technology (January 2026). Customer Engagement Solutions Market Size, Share & Trends Forecast 2033. skyquestt.com