AI Ad Optimization:
The Secret Weapon Behind
High-Conversion Campaigns
How machine learning rewired the entire stack of digital advertising — from the auction millisecond to the creative pixel — and why most brands are still only using 20% of what’s available to them.
There’s a moment in every serious ad campaign review where someone finally says what everyone in the room is thinking: “We don’t really understand why it worked.” The dashboard shows a 3.1× ROAS. The attribution model is blinking green. But ask the team to explain which creative variant, which audience signal, which bid adjustment at 11:47 pm on a Tuesday actually tipped a hesitant browser into a buyer — and you’ll get silence. Or worse, a confident-sounding guess dressed up as analysis.
This is what distinguishes the current era of AI-driven ad optimization from every previous wave of ad-tech hype: for the first time, the machine genuinely knows things the human team doesn’t. Not in a hand-wavy “big data” sense. In a mechanistically verifiable, millisecond-precision, auction-by-auction sense that would have seemed like science fiction to a performance marketer in 2015.
I’ve spent the past several years embedded in this space — consulting on campaigns across e-commerce, SaaS, and direct-response finance — and I’ll tell you plainly: the gap between teams who understand AI ad optimization at a systems level and those who operate it like a vending machine is the single largest source of competitive advantage in digital marketing right now. And it’s widening, not narrowing.
This is my attempt to close that gap for serious practitioners. We’ll go deep into the mechanics, the economics, the failure modes, and the honest cases where AI delivers and where it doesn’t. No vendor slides. No cherry-picked uplift numbers without context.
The AI Ad Optimization Stack, Explained from First Principles
Before we go anywhere useful, we need a shared mental model. Most practitioners think about AI ad optimization as a single dial — a “smart” setting on a platform — when it’s actually a stack of at least four distinct, interacting systems. Conflating them is what leads to bad strategy decisions.
Here’s how I think about the layers:
The Four-Layer AI Ad Stack
The Auction Layer (Bidding Intelligence)
Operates in milliseconds. Determines how much to bid for each impression, who to target, and when to walk away. This is Smart Bidding, Target ROAS, Performance Max at the auction level.
The Creative Layer (Dynamic Creative Optimization)
Assembles the actual ad — image, headline, CTA, color scheme — from modular components in real time, tuned to the signal of the moment (location, device, intent, weather, recency of prior visit).
The Data Layer (Audience Intelligence)
Constructs, segments, and enriches audience profiles using behavioral signals, contextual signals, and first-party CRM data. Feeds both the auction and creative layers.
The Attribution Layer (Measurement Intelligence)
Answers the question: what actually caused the conversion? Increasingly powered by data-driven attribution models and incrementality testing rather than last-click rules.
The mistake most teams make is optimizing one layer in isolation. You can have world-class bidding intelligence and destroy its output with static, irrelevant creative. You can have brilliant DCO running on stale audience data. The game is about the interface between these layers — where first-party data flows cleanly from your CRM into your DSP’s bidding model while your DCO system simultaneously receives the same signal to serve a contextually matched creative.
When the four layers are synchronized, you stop paying for attention and start engineering conversion probability.
Figure 1. The Four-Layer AI Ad Stack. Signal flows down through each layer; conversion data feeds back up as a continuous optimization loop. Most teams only actively manage Layers 1 and 3, leaving DCO and attribution underutilized.
Predictive Bidding: The Auction Layer
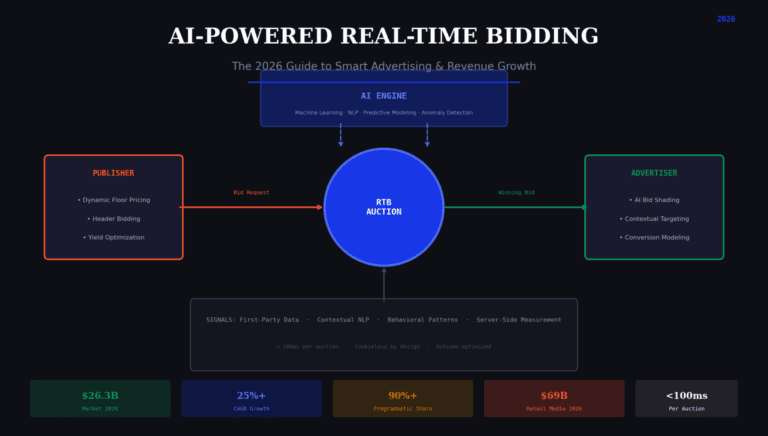
Every programmatic ad auction happens in roughly 100 milliseconds — faster than a human blink. In that window, Google’s Smart Bidding or a DSP’s machine learning engine evaluates somewhere around 70 million signals per auction to predict whether this specific person, on this specific page, at this specific moment, is likely to convert. Then it calculates the maximum it should pay for that impression without violating your target CPA or ROAS constraint.
This is not A/B testing. This is not a rule-based system. This is continuous gradient descent on a live prediction model, retrained on your account’s conversion history, updated in near real-time.
The signals the model processes include things no human can systematically incorporate: the device’s battery level (yes, this is real — low battery correlates with distracted browsing behavior), the precise sequence of pages visited in a session rather than just the category, the time since last relevant search query, the local weather at the user’s physical location, and cross-device behavioral patterns built from probabilistic identity graphs.
The Conversion Data Problem Nobody Warns You About
Here’s where I need to make an admission, because I’ve seen it go wrong in practice:
I spent months early in my career telling clients to “just turn on Target ROAS and let Google learn.” I was wrong. Without sufficient conversion volume, Smart Bidding doesn’t optimize — it hallucinates. The model needs a minimum signal density to learn anything meaningful. For accounts generating fewer than 30–50 conversions per month, Smart Bidding can actually decrease performance versus manual bidding because the model lacks data to distinguish signal from noise.
The platform dashboards don’t tell you this loudly enough. I have watched campaigns crater in the “learning” phase and been assured by reps that the algorithm just needed more time. Sometimes it did. But more often, the account simply didn’t generate enough conversion events to calibrate the model properly.
The solution isn’t to avoid Smart Bidding — it’s to understand the minimum viable conversion signal. If your actual macro-conversion (sale, lead form) happens fewer than 30 times a month, you need to set up micro-conversion goals (add to cart, video view, page depth) as supplementary signals. One enterprise B2B client I worked with was firing Smart Bidding on 9 deals a month. After we added tracked SQLs, demo requests, and key page visits as value-weighted micro-conversions, the model had 400+ valued actions per month to train on — and cost per SQL dropped 34% within six weeks.
Figure 2. Indicative ROAS improvement from Smart Bidding vs. manual CPC, plotted against monthly conversion volume. Below ~30 conversions/month, Smart Bidding often performs at or below manual baselines. Above 75 conversions, gains of 25–40% are well-documented. Curves are illustrative composites based on published industry benchmarks from Google, eMarketer, and campaign audits.
What Performance Max Actually Does (and What It Hides)
Google’s Performance Max — launched at scale in 2022 and now the dominant campaign structure for most mid-to-large accounts — is the most powerful and most opaque manifestation of Layer 1 bidding intelligence. PMax feeds across Search, Shopping, YouTube, Display, Discover, and Gmail simultaneously, letting the auction engine allocate budget to whichever channel and placement it predicts will deliver the best conversion outcome for that moment.
Results data from accounts switching from manual CPC to Target ROAS via PMax shows average improvements of 25–40% in conversion value within four to six weeks of the learning phase concluding. That’s a real, meaningful number — not a vendor slide.
But the opacity is real and it matters: PMax reduces visibility into which placements are converting, which search terms triggered ads, and which creative assets drove performance. This isn’t a bug in the conventional sense — it’s a deliberate architectural choice to prevent human interference that would degrade model performance. The problem is that it also prevents you from catching brand safety issues, wasted spend on irrelevant queries, and creative assets that are technically converting but destroying your brand voice. You need to build manual review checkpoints around PMax, not inside it.
One structural approach that consistently works: run PMax for upper-funnel discovery, retain a separate search campaign with exact-match and phrase-match brand terms, and use negative keyword lists at the account level to prevent PMax from cannibalizing your branded search traffic. Without this, PMax routinely claims credit for conversions it didn’t generate — a measurement artifact that inflates its apparent ROAS.
Dynamic Creative Optimization: The Creative Layer
If predictive bidding is the engine, DCO is the steering wheel — and it’s the layer most teams are most dramatically underutilizing.
The basic premise sounds almost trivially obvious: instead of serving a single static ad creative to an audience of a hundred thousand people, you construct each ad from modular components at the moment of delivery, tuned to what you know about that specific user at that specific instant. Different headline for someone who arrived from a competitor comparison search. Different product image for someone in their 40s versus their 20s. Different CTA for a first-time visitor versus someone who abandoned their cart 48 hours ago. Different offer based on local weather conditions (McDonald’s in Qatar, of which more later).
The performance data is hard to argue with. A 2024 survey by Digiday and Clinch found that 99% of agencies consider DCO significant in their strategies. Industry research analyzing 1.1 million video ad variations across 1,300 apps and $2.4 billion in ad spend found platform-specific IPM (Installs Per Mille) lifts of up to 33% on ad networks and 65% on social. Marketers using DCO consistently report click-through rates 30–50% above static ad baselines, with early adopters seeing ROAS improvements of 10–30%.
Figure 3. DCO vs. static creative performance across four metrics. Ranges compiled from Segwise.ai (1.1M ad variations), StackAdapt case studies, AiBoost DCO research (2025), and McKinsey personalization benchmarks. Individual campaign results vary significantly by vertical, data richness, and DCO platform.
How DCO Actually Works at the Millisecond Level
When a user loads a page that triggers a programmatic ad call, the sequence of events that produces a DCO ad is:
The ad server receives the impression opportunity, including contextual signals from the page, device type, location, time, and audience segment data from the DMP or CDP. The DCO engine — which has pre-ingested your creative asset library: 8 headlines, 6 images, 4 CTAs, 3 color schemes, 2 offers — queries its decision model. That model, trained on prior performance data, predicts the winning combination for this specific user and context in roughly 80 milliseconds. The assembled creative is returned and served. The outcome (click, conversion, or ignored) is logged and fed back into the training data. The entire loop closes, and the model gets imperceptibly smarter.
This is fundamentally different from A/B testing. You’re not waiting for statistical significance across a two-variant test over three weeks. You’re running what is effectively a continuous, multi-armed bandit experiment across potentially thousands of creative combinations, with real-time reallocation of serving probability toward winners.
McDonald’s ran Qatar’s first weather-responsive pDOOH campaign for its Summer Coolers line. Creative was triggered only when local temperatures exceeded 35°C, serving heat-context messaging to audiences at digital outdoor screens. The result: a 7% sales lift for the Summer Coolers lineup, with supporting data from Analytic Partners suggesting weather-adjusted creative can drive up to 57% higher performance than traditional static approaches. The campaign was executed in partnership with Splicky DSP, Elan Media, Saatchi & Saatchi, and Broadsign. Source: Broadsign DCO in OOH analysis, 2025.
Audience Intelligence: The Data Layer
Let’s talk about the uncomfortable center of this whole system: data. Specifically, the collapse of third-party data and what it actually means for AI-powered campaigns in 2026.
The cookie deprecation story has been told so many times it’s become wallpaper. But the operational reality for most advertisers is more nuanced than “third-party cookies are dead, use first-party data.” The truth is that third-party segment performance was already degrading for years before Google finalized its opt-in approach in 2025 — audience match rates had been falling, segment inflation was endemic, and the ITP changes in Safari had already wiped out significant behavioral tracking capacity for a substantial portion of web traffic.
What the AI layer has enabled, though, is a genuinely better alternative: contextual intelligence powered by large language models. Rather than tracking what a specific person has done across the web, modern LLM-enhanced contextual engines analyze the content environment at a granular level — not just “this is a tech website” but “this article discusses enterprise SaaS procurement for mid-market B2B companies concerned about integration complexity.” That context can be matched to intent signals that are often more predictive of purchase probability than behavioral retargeting was.
Research published in 2025 found that 72% of consumers report that the content surrounding an ad influences their perception of that ad — which gives you a sense of why contextual placement quality is increasingly a performance variable, not just a brand safety variable.
The First-Party Data Architecture That Actually Works
The brands consistently outperforming in AI ad environments share one structural characteristic: they treat their first-party data as a live, continuously enriched asset rather than a CRM export they upload to Meta twice a quarter.
The practical architecture looks like this: CRM data (purchase history, LTV segments, email engagement) synced to the ad platforms via Customer Match / Custom Audiences in as close to real-time as the platform APIs allow. On-site behavioral signals (page depth, content categories engaged, product views, cart events) passed via server-side tagging to clean up attribution in a post-cookie environment. These signals flow into both the bidding model (Layer 1) and the DCO engine (Layer 2) simultaneously, creating a unified signal that the system can actually learn from.
The companies who haven’t built this infrastructure are running AI ad optimization on impoverished data. The algorithms aren’t broken — they’re just starving. And you can’t solve a data quality problem with a budget increase.
Figure 4. Illustrative AI campaign performance potential (indexed relative to a no-first-party-data baseline) as first-party data richness increases. The non-linear jump between “Full CRM + Events” and “Real-time CDP” reflects the compound effect of live behavioral signals feeding both the bidding model and DCO engine simultaneously. Illustrative composite based on industry research including 2.9× ROI lift (first-party vs. third-party, 2025), Meta Custom Audiences studies, and CDP platform benchmarks.
Unit Economics: What AI Ad Optimization Actually Costs and Returns
Let’s do some math. I’m going to work through a unit economics model for a mid-market e-commerce brand moving from a manual campaign structure to a fully AI-optimized stack. The numbers are illustrative but calibrated against real benchmarks I’ve seen across multiple accounts. I’ll show the assumptions.
Baseline: Manual Campaign Structure
Post-AI-Optimization: Full Stack (12-Week Ramp)
This model assumes: (a) the account generates sufficient conversion volume for Smart Bidding to function effectively (600+ monthly conversions in the AI scenario, which passes the threshold), (b) the team has the first-party data infrastructure to feed the bidding and DCO systems, and (c) a 12-week learning ramp where performance dips before improving. Most accounts don’t see full performance gains until weeks 8–14. A significant minority never reach the projected improvements due to creative quality issues, insufficient data, or industry-specific targeting constraints.
I have also seen this math go the other way. Don’t run it as a guarantee.
The Hidden Cost: Creative Production at DCO Scale
The unit economics model above glosses over a real operational challenge: DCO requires a creative asset library that most marketing teams aren’t built to produce. To run meaningful DCO across a campaign — say, 6 headlines, 5 images, 4 CTAs, 3 offers — you’re producing 360 potential combinations from 18 source assets. For a serious campaign covering multiple product categories and audience segments, you might need 80–120 distinct creative elements per channel.
This is where generative AI enters as a practical cost lever. AI-assisted creative production (using tools like Adobe Firefly, Google’s asset generation in PMax, or Meta’s Advantage+ Creative) can reduce creative production costs by 40–60% while increasing iteration speed dramatically. The caveat is quality control: generative AI-produced assets require human review for brand voice, factual accuracy, and legal compliance — particularly in regulated categories like finance, healthcare, and alcohol.
Seven Ways AI Ad Optimization Fails
I want to spend real time here because the discourse around AI ad optimization is overwhelmingly vendor-positive, and the failure modes are where the real learning happens.
Figure 5. AI ad optimization failure mode risk matrix. Bubble size indicates relative cost/severity if the failure occurs. “Attribution inflation” and “Insufficient conversion data” are the two highest-impact, highest-likelihood risks for most accounts.
1. The Conversion Data Starvation Problem
Already discussed above, but worth naming explicitly in this list: Smart Bidding and AI targeting systems fail silently when they don’t have enough signal. The model will still run. It will still report a ROAS. That ROAS will be wrong.
2. Attribution Inflation
This is the one that keeps me up at night. When Google’s Performance Max claims a conversion that originated from a branded search query that would have happened regardless of any paid ad, or when Meta’s algorithm attributes a sale to a view-through impression that had zero causal relationship to the purchase decision, you’re not looking at performance data — you’re looking at a mirage. AI ad platforms have a structural incentive to attribute as many conversions as possible to themselves. Your last-click-vs-data-driven attribution gap can easily exceed 40% on mature accounts.
The mitigation: run incrementality tests. Holdout experiments — where you deliberately suppress ads to a randomly selected portion of your audience and measure the conversion difference against the exposed group — are the only reliable way to measure true AI advertising impact. Google’s Experiment tool and Meta’s Conversion Lift studies both support this approach.
3. Brand Safety in the Black Box
Performance Max and programmatic display campaigns can — and do — place your ads in contextually inappropriate environments. I’ve seen e-commerce brands appear alongside graphic news content, financial services ads next to conspiracy forums, and children’s product ads appearing on gaming sites with adult content. The AI optimizes for conversion signal, not for the brand implications of where that conversion signal was generated.
Category exclusions, placement exclusions, brand safety verification partners (DoubleVerify, IAS), and regular placement reporting audits are non-optional components of any AI-driven programmatic campaign.
4. Creative Fatigue at Scale
DCO creates a new problem: when the AI discovers a winning creative combination, it hammers it. Frequency caps help, but in small or niche audiences, you can burn through your most effective creative combination in two to three weeks and find performance collapsing. You need a creative refresh cadence — new assets introduced at regular intervals — and automated creative fatigue detection (frequency > 4–5 against the same user within 7 days is often the trigger).
5. The Learning Phase Disruption Trap
Smart Bidding campaigns enter a “learning” phase whenever a significant change is made: new bid strategy, substantial budget change, new conversion action. During learning, performance degrades — often dramatically — before recovering. Making frequent changes based on short-term performance fluctuations creates an endless loop of relearning. Campaigns need stability windows of 2–4 weeks minimum before judgment can be passed on a new configuration.
6. Algorithmic Bias
AI optimization systems learn from historical conversion data. If your historical customers skew toward a particular demographic, income bracket, or geography, the algorithm will increasingly concentrate spend toward those profiles — excluding potentially valuable customer segments it has never had the chance to learn from. This is particularly acute for brands trying to expand into new markets or demographic groups. The model doesn’t know what it doesn’t know.
7. Walled Garden Lock-In
The more you optimize within a single platform’s AI ecosystem — feeding it first-party data, training its models on your conversion history — the more you become dependent on that platform’s pricing, policies, and performance claims. This isn’t necessarily fatal, but it’s a strategic risk that needs active management: maintain cross-platform presence, build owned measurement infrastructure, and avoid allowing any single platform to hold a data monopoly on your customer relationships.
Three Real Case Studies (With Numbers)
JPMorgan Chase × Persado: AI Copywriting at Enterprise Scale
This is one of the most extensively documented AI advertising experiments on record. JPMorgan Chase’s partnership with AI language optimization platform Persado began in 2016, testing AI-generated copy for Chase Card and Mortgage display advertising. The Persado “Message Machine” draws on a database of over one million tagged and scored words and phrases, analyzed for emotional resonance and intent.
The pilot results: up to 450% lift in click-through rates on ads rendered by Persado, compared to human-written copy that achieved 50–200% lifts against control. Human-written: “Access cash from the equity in your home.” AI-written: “It’s true — You can unlock cash from the equity in your home.” A subtle shift from transactional utility language to validation + possibility framing. In 2019, Chase signed a five-year enterprise-wide deal to expand Persado across marketing, internal communications, and customer service.
The honest addendum: the WARC analysis noted that the headline metric (CTR) doesn’t capture whether those clicks represented higher-quality prospects. CTR optimization can drift from conversion optimization if the objectives aren’t carefully aligned. Chase was aware of this tension — the expansion of the relationship to enterprise-wide suggests they found downstream value — but the lesson is worth carrying: AI optimizes what you tell it to optimize. Define your objective function carefully.
Source: Persado press release, July 2019; Marketing Dive; Quartz.
Global Industrial × StackAdapt DCO: Cart Abandonment Recovery
Global Industrial, a major distributor of industrial and commercial products, partnered with Vallo Media to address cart abandonment using StackAdapt’s Dynamic Creative Optimization platform. The challenge: re-engaging shoppers who had added specific products to carts without purchasing, at scale and without prohibitive creative production costs.
The DCO approach: serving display ads that dynamically displayed the exact products each user had left in their cart, combined with audience behavioral targeting. The results were documented: 60% increase in CTR over static retargeting creative, with DCO-attributed ad revenue accounting for 30% of total campaign revenue using only 12% of the total campaign budget. The efficiency ratio — 30% of revenue from 12% of spend — is the key figure. That’s 2.5× capital efficiency from personalization alone.
Source: StackAdapt case study, 2025.
Fashion&Friends × DCO: Full-Funnel ROAS Transformation
Fashion&Friends, a leading Southeast European fashion e-commerce brand, implemented DCO across social channels with personalized product creative. The campaign used behavioral signals — specifically prior browsing history and purchase patterns — to serve ads featuring products each user had previously engaged with.
Results across the campaign period: 73% boost in ROAS, 72% increase in purchases, 62% lift in website purchase conversion rate, and 50% reduction in CPA. These figures are representative of what’s achievable when DCO is combined with strong first-party behavioral data and a creative asset library rich enough to generate meaningful personalization. They are not typical for teams without those inputs.
Source: Hunch DCO case studies; Hawky.ai platform documentation.
The Attention Race: A New Mental Model for AI Advertising
Here’s the framework I use when I think about where AI ad optimization is taking us, and why the competitive dynamics are so unforgiving.
Advertising has always been an attention game. But historically, attention was purchased as a relatively undifferentiated commodity — you bought a slot, a page, a slot during a broadcast, and you reached whoever was there. The creative doing the work of qualifying, engaging, and converting was a human creation deployed at fixed intervals.
AI ad optimization changes the unit of competition from the campaign to the impression. Every auction is a micro-competition between you and every other advertiser eligible to reach that person at that moment. Your AI is competing against theirs — in pricing, in targeting precision, in creative relevance, in measurement sophistication — every single time. The feedback loop is constant.
“The unit of competition in AI-driven advertising is no longer the campaign — it’s the impression. At the auction level, your model is fighting every other eligible advertiser’s model, in real time, constantly. This is the attention race.”
— Original framework, AIPersonalization.cloud, 2026The consequence of this framing: in markets with significant AI advertising adoption, the performance gap between sophisticated AI users and unsophisticated ones doesn’t plateau. It compounds. An AI system with more conversion data, better first-party signals, and richer creative assets produces more conversions, which feeds better data back into the model, which produces better conversion rates, which generates more budget to invest, which produces more data. The rich get richer in a mathematically compounding way that has no analogue in the pre-AI ad landscape.
This is why 72% of marketers are planning to increase programmatic investment in 2025, with the market projected to exceed $800 billion globally — it’s not irrational exuberance, it’s a rational response to a compounding competitive advantage that punishes abstention.
Figure 6. The AI advertising compounding advantage loop. Each element feeds the next: better data trains smarter models, smarter models produce higher returns, higher returns generate more budget and more conversions, more conversions produce richer data. The cycle self-reinforces. Teams that enter later start at a structural disadvantage that grows over time.
The Uncomfortable Truth About AI Ad Optimization
Most of the brands investing most heavily in AI ad optimization are making themselves simultaneously more efficient and more fragile. By ceding more and more of the advertising decision layer to platform black boxes — trusting Google and Meta’s algorithms to decide not just how to bid but what to say, to whom, in what context — they are building performance on infrastructure they don’t understand, can’t audit fully, and can’t move off of without substantial performance degradation. The same data flywheel that creates the compounding advantage loop also creates the compounding dependency loop.
When — not if — a major platform changes its auction dynamics, attribution methodology, or data policy, the brands most deeply integrated into its AI ecosystem will be the most exposed. The CPM crashes in January 2025 (display CPMs fell 33% YoY, video CPMs dropped 39%) were a preview. Diversification of channels, investment in owned media and data assets, and maintaining enough internal capability to evaluate platform claims critically are not optional retreats from AI — they are the mature AI strategy.
The counterpoint, which is also true: if you’re not in the compounding loop at all, you’re losing ground to competitors who are. The answer isn’t to avoid AI ad optimization. It’s to engage with it strategically — with clear measurement discipline, owned data infrastructure, and a clear-eyed understanding of where the platforms’ interests and yours don’t align.
What Actually Works in 2026: A Practitioner’s Checklist
I’ll close with what I’d actually prioritize if I were taking over a mid-market performance marketing operation today and wanted to build a durable AI ad optimization capability — not just turn on a few platform features.
Foundation: Data Infrastructure First
Before optimizing any campaign, audit your conversion data quality. Are you tracking enough events? Are they correctly attributed? Is your CRM data syncing to your ad platforms in near real-time? If your data layer is broken, AI optimization amplifies the brokenness. Fix the foundation before buying the features.
Specifically: implement server-side tagging to reduce tracking loss from browser restrictions. Sync your CRM customer segments (at minimum: high-LTV customers, recent purchasers, lapsed customers, and email subscribers) to your ad platforms as custom audiences for bidding signals and exclusion lists. Establish a Customer Data Platform or equivalent data integration layer that makes first-party signals available to both bidding and DCO systems simultaneously.
Bidding: Earn the Right to Smart Bidding
Don’t activate Target ROAS or Target CPA until you have sufficient conversion volume. Use micro-conversion event stacking to reach the minimum threshold. Once you’ve activated Smart Bidding, commit to stability windows of 4–6 weeks minimum before evaluating configuration changes. Treat learning phase performance dips as expected, not as failures.
Creative: Build the Asset Library for DCO
Map your audience segments to creative themes. For each segment, produce: at least 4 headline variations (different emotional registers — urgency, curiosity, validation, utility), at least 3 image treatments (lifestyle, product-only, social proof), 2–3 CTA options, and at minimum 2 offer variants if applicable. This gives you meaningful combinatorial variation without an unmanageable production burden. Use generative AI tools to accelerate production of image variants, but maintain human review for brand voice and compliance.
Measurement: Build Independent Verification
Run incrementality tests — even simple holdout experiments — on your highest-spend channels quarterly. Build a model for true incremental CPA that doesn’t rely solely on platform attribution. Compare platform-reported conversions against your CRM or backend order management data regularly. If the gap between platform attribution and actual backend conversions exceeds 20%, you have a measurement integrity problem that will corrupt all your optimization decisions.
Governance: Maintain Human Oversight
Establish weekly audit routines for: placement reports (brand safety), search term reports (query relevance), asset performance within DCO (creative fatigue detection), audience performance (demographic concentration monitoring for bias indicators), and attribution anomalies. The platforms won’t flag these for you proactively. This is the human layer that keeps the AI layer honest.
AI ad optimization is not a set-it-and-forget-it capability. It is a system that requires active stewardship: high-quality data in, honest measurement out, creative fuel continuously replenished, and human judgment applied where the algorithm’s incentives diverge from yours. The teams who win long-term are not those who trust AI the most — they’re those who understand it well enough to know exactly where to trust it, and exactly where to override it.
The gap between what’s possible and what most organizations are extracting from AI advertising tools remains enormous — by most estimates, brands are leveraging perhaps 20–30% of available AI capability in their campaigns. That gap is not a reason for pessimism. It’s the largest untapped source of marketing ROI available to serious practitioners in 2026.
Use it wisely.
Behavioral vs Demographic Segmentation: Which One Really Drives Online Sales?
Predictive Content Optimization: Using Data Analytics to Drive Personalized Experiences
Top 7 AI Digital Marketing Strategies
AI Predictive Models in Marketing: Turning Data into Conversions and Profits