
Key takeaways
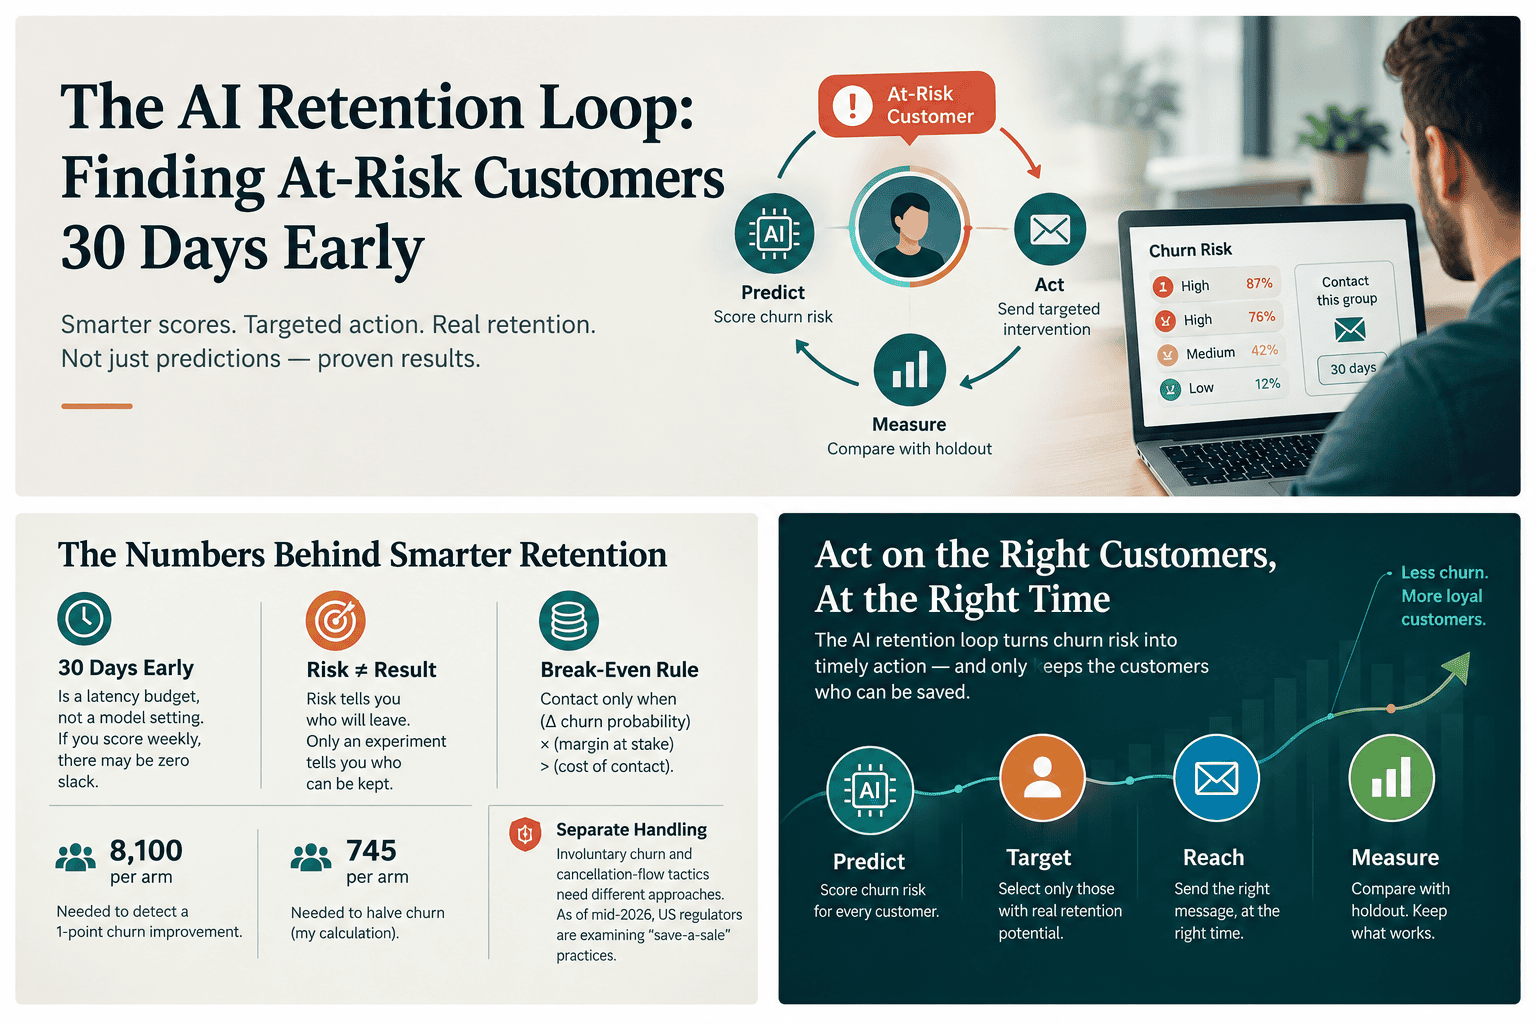
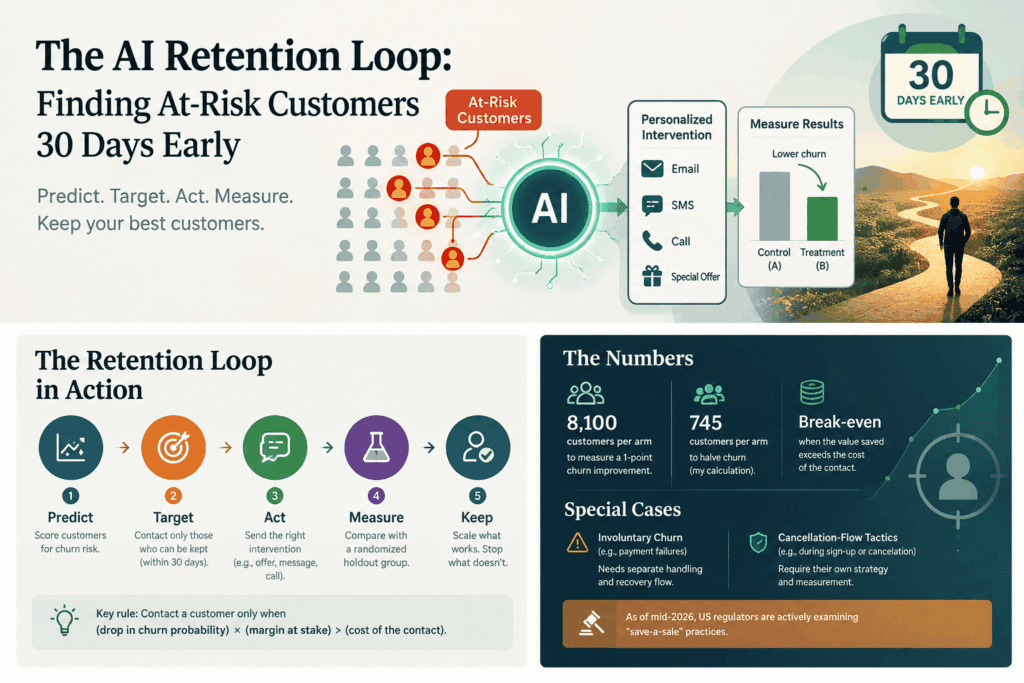
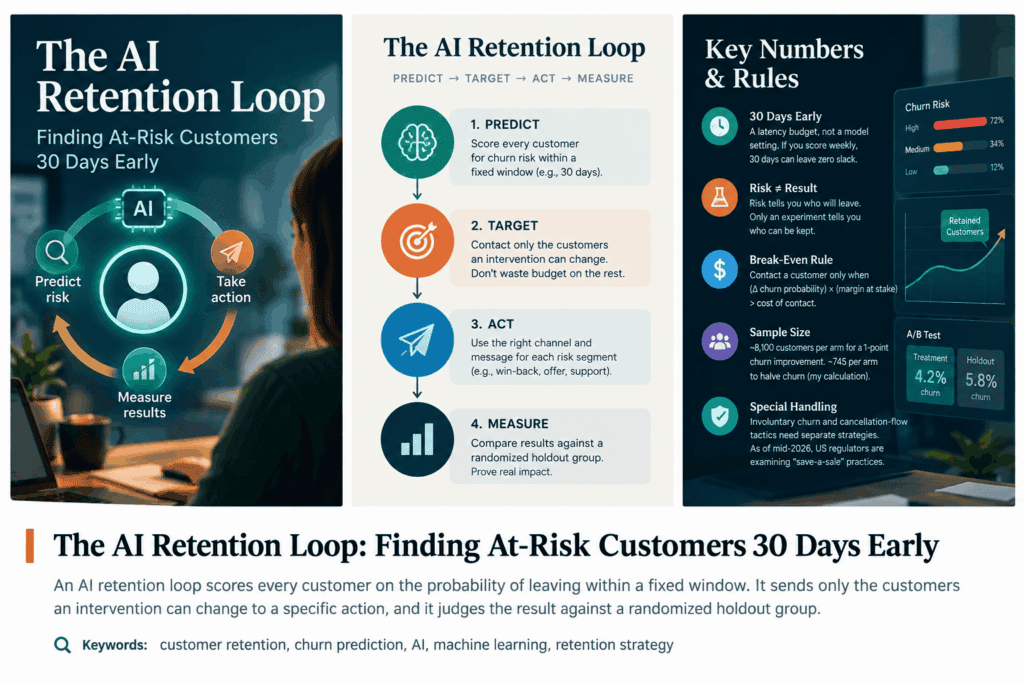
- An AI retention loop scores customers on churn risk, targets the customers an intervention can actually change, acts, and measures the result against a randomized holdout. A score without that measurement is a dashboard, not a loop.
- Risk is not persuadability. In a randomized field experiment, a plan-recommendation campaign raised churn. Published work on targeting by response rather than risk points in the same direction.
- “30 days early” is a latency budget, not a model setting.
- Break-even rule: contact a customer only when (drop in churn probability) × (margin at stake) > cost of the contact.
- You do not need perfect causal measurement to start. The maturity ladder shows what is worth doing at each level, and when staying put is rational.
- B2B changes the math. With a few hundred logos and annual renewals, most teams cannot read a modest effect from one renewal cycle.
- Cancellation-flow tactics are a separate, regulated problem. Keep the loop on the pre-decision side.
Confidence labels.
- [Evidence]: published research or a primary document I reviewed.
- [Evidence, secondary]: I reviewed only a summary, abstract, or press account, not the full source.
- [Inference]: reasoning from evidence, untested.
- [Judgment]: my opinion.
- [Illustrative]: invented numbers that show mechanics, never measurements.
What an AI retention loop is
| # | Station | What happens | Typical failure |
|---|---|---|---|
| 1 | Signals | Usage, support, billing, contacts, relationship data | Late signals that leak the outcome |
| 2 | Features | Trends against the customer’s own baseline, as of date t | Levels instead of changes; temporal leakage |
| 3 | Score | Calibrated probability of leaving in a fixed window | Good rank order, bad calibration |
| 4 | Target | Rank by estimated response to contact, cap at capacity | Skipped; ranking by risk alone |
| 5 | Intervene | Fix, teach, human touch, offer, or nothing | Templated outreach from the wrong owner |
| 6 | Measure | Compare against a randomized holdout at 30/60/90 days | Counting “saves” instead of incremental retention |
Stations 1–5 must fit inside your horizon. Station 6 feeds station 1. Most “predict churn early” projects stop at station 3. The failures cluster in stations 4–6.
The evidence that risk is not persuadability
The carrier experiment. Researchers randomly assigned 65,000 customers of a South American wireless firm to receive a recommendation for a cost-saving plan or nothing. In the following three months, about 6% of the control group churned versus about 10% of the treated group. The authors propose two mechanisms: the campaign lowered customers’ inertia about switching, and it made past usage patterns more salient to potential churners. Source: Ascarza, Iyengar & Schleicher, “The Perils of Proactive Churn Prevention Using Plan Recommendations,” Journal of Marketing Research 53(1), 46–60 (2016). [Evidence, secondary.] What I reviewed: the Columbia abstract (which states the 6% control figure), Columbia’s press release, and Wharton Knowledge (the source of the 10% figure). What I did not review: the full paper, so I cannot vouch for its sample construction, robustness checks, or any figure beyond those reported in those summaries. One experiment in one telecom market is not a law of nature. The lesson is that contact is a stimulus whose effect must be measured.
Targeting by response, not risk. Eva Ascarza’s “Retention Futility: Targeting High-Risk Customers Might Be Ineffective” (JMR 55(1), 80–98, 2018) combines two field experiments with machine learning. It finds that the customers at highest risk are not necessarily the best targets, and that firms should model sensitivity to the retention effort. The paper won the 2018 Paul E. Green Award and the 2023 Weitz-Winer-O’Dell Award. The AMA’s 2023 summary reports that sensitivity-based targeting reduced churn more than risk-based targeting in its simulations, and that in some instances risk-based targeting increased churn. [Evidence, secondary.] What I reviewed: the AMA summary and award descriptions. What I did not review: the full paper, its experimental designs, or its effect sizes. Do not carry its magnitudes to your business; the data are from telecom and membership settings.
Learning who responds when outcomes are slow. Huang & Ascarza, “Doing More with Less: Overcoming Ineffective Long-Term Targeting Using Short-Term Signals” (Marketing Science 43(4), 863–884, 2024), propose a surrogate index that uses short-term outcomes to estimate long-term effects. Per its abstract, using short-term signals improved long-run targeting in simulation and in a real-world application. [Evidence, secondary: abstract only.] I did not review the full paper, so I cannot assess the surrogate assumptions it relies on or how well they would transfer to B2B renewal data. This matters for B2B, where renewal is far away.
The through-line: risk tells you who will leave. Only an experiment tells you who can be kept.
“30 days early” is a latency budget
Thirty days is the time your organization needs to notice, decide, and act. A hypothetical mid-market SaaS team [Illustrative]:
| Stage | Best case (days) | Worst case (days) |
|---|---|---|
| Signal refresh (nightly batch) | 1 | 1 |
| Wait for next scoring run (daily vs. weekly) | 0 | 7 |
| Routing and owner pickup | 1 | 3 |
| First real conversation with the customer | 3 | 7 |
| Time for the fix to change behavior | 7 | 14 |
| Total consumed | 12 | 32 |
In the worst case, the process consumes the whole window. Set the horizon after measuring your slowest reliable intervention.
The decision date is not the cancellation date. For annual B2B contracts, the customer usually decides well before the paperwork, so a score computed 30 days before contract end may be scoring a decision already made. [Inference from how contracts work.] Define the label around the earliest observable proxy (seat reduction, stalled renewal thread, champion departure, non-renewal notice) and consider a 90–180 day horizon.
Silent churn. In non-contractual and hybrid relationships, customers can leave without a cancellation event; see Ascarza, Netzer & Hardie, “Some Customers Would Rather Leave Without Saying Goodbye,” Marketing Science 37(1), 54–77 (2018). [Evidence, secondary: title-level only. I did not review the paper.] The practical point is that “no cancellation event” is not “still engaged.” Test engagement signals before trusting them. [Judgment.]
The signal layer: what goes in, and what quietly ruins it
Use changes, not levels. Twelve logins a week is thriving against a baseline of 5 and alarming against a baseline of 40. Features that usually earn a place [Judgment]: usage slope, breadth (features or seats), support friction (reopened tickets), commercial events (failed payments, seat reductions), and relationship changes (champion or sponsor leaves).
Late signals inflate accuracy and destroy usefulness. Cancellation-page visits, export requests, and “close my account” tickets lift your metrics and arrive inside your latency budget. Exclude anything that appears only after the decision.
Leakage has two forms. The technical form is covered in scikit-learn’s common pitfalls guide: split before preprocessing, never fit on test data, use a pipeline. [Evidence.] The temporal form is churn-specific. With one row per customer per week, a random split puts week 10 in training and week 11 in test, and the model memorizes people. Split by time. [Inference; the scikit-learn guide does not cover it.] Case 7 below shows what this can do to a model’s apparent edge.
Separate voluntary from involuntary churn. A failed card is a payments problem (retry logic, card updaters, dunning). Mixing it into the label sends your success team after customers who never wanted to leave.
Cold start. A customer in week two has no trend. Use cohort rules and onboarding milestones until history accumulates.
Model and evaluation: what to demand before trusting a score
Gradient-boosted trees on snapshot features are a defensible baseline. When many customers have not yet churned (they are censored), survival models such as Cox regression fit the structure better than a fixed-window classifier. [Judgment.] Whatever you choose, require:
- Beat a rules baseline. “Usage down sharply over four weeks plus an open high-priority ticket” is a legitimate benchmark.
- Precision at capacity. If the team can work 40 accounts a week, how many of the top 40 churn without help? AUC cannot answer that.
- Calibration. If the model says 20%, about 20% should churn. The economics below multiply probabilities by dollars.
- Temporal validation and drift monitoring. Track score distributions and precision monthly.
Reason codes describe the prediction; they are not causal. A low-usage flag does not prove that raising usage would keep the customer.
The 2×2 and the break-even rule
| Contact backfires or does nothing | Contact reduces churn | |
|---|---|---|
| High baseline risk | Lost causes. Top of every risk ranking. | Persuadables. The only quadrant where spend pays back. |
| Low baseline risk | Sleeping dogs. Contact prompts a review of what they pay for. | Sure things. They stay regardless; a discount is pure subsidy. |
Quadrant names are standard uplift-modeling vocabulary. A risk score locates a customer on the vertical axis only; the horizontal position comes from experiments.
Let u be the drop in churn probability caused by the intervention, V the margin kept if the customer stays, and C the cost per contact. Contact when u × V > C. Break-even uplift is C ÷ V.
Worked example [Illustrative: every input is an assumption]
- 10,000 subscribers, 3% churn in 30 days → 300 expected churners
- Top risk decile (1,000 customers) captures 40% of them → 120 churners (12% among flagged)
- C = $15 per contact (loaded, including any discount paid to customers who would have stayed); V = $600
- Break-even uplift = 15 ÷ 600 = 2.5 percentage points
| Policy | Contacted | Assumed avg. uplift | Net result |
|---|---|---|---|
| Contact nobody | 0 | n/a | $0 |
| Top 1,000 by churn risk | 1,000 | 1.5 pts | 15 saves × $600 − $15,000 = −$6,000 |
| Top 1,000 by estimated uplift | 1,000 | 4.0 pts | 40 saves × $600 − $15,000 = +$9,000 |
The risk-ranked policy loses money even with a decent model. The ceiling, if all 120 flagged churners were savable, is $72,000, which is the number a demo slide quotes. The 1.5 and 4.0 figures are assumptions; in a real program, they are what you measure. “Do nothing” beats one of the two policies, so it belongs in your experiment as an arm.
After the score: the operational reality
Most of these are patterns I expect from how handoffs typically work. They are not a measured taxonomy. [Judgment.]
- No context. “Account X: 74% risk” gives the owner nothing to say. Pair reason codes with a recommended action.
- Wrong owner. A pooled queue means no owner; routing to the named CSM may mean the person who already gave up on the account. Decide ownership per action type.
- Templated outreach. Given the carrier experiment, generic contact can itself be the trigger.
- Timing mismatch. The flag fires Tuesday, the QBR is in six weeks, the CSM waits. Track time-to-first-action.
- Capacity ignored. 300 flags for a team that can work 40 produces cherry-picking. Cap the list.
- Overrides discarded. A CSM who skips a flag usually has a reason. Log it; it is the cheapest model feedback you have.
- Discount as default. The easiest action to execute is the costliest to be wrong about.
Intervention design [Judgment]
| Diagnosis | Default action | Avoid |
|---|---|---|
| Unresolved bug, integration failure, billing error | Fix, then tell the customer | Leading with a discount |
| Narrow usage (few features or seats) | Teach: a working session on one use case | Generic training invitations |
| High-value account; champion change | Human touch: CSM or executive call with a specific agenda | An executive call with no purpose |
| Active use, confirmed price pressure or competitor in play | Offer: right-sizing, annual prepay, restructure | Blanket discounts |
| Low measured uplift, no diagnosis, or a segment where contact backfired | Nothing | Contacting because the dashboard is red |
What to say. Lead with the specific thing you saw and the specific help you can give: “Two integration tickets were reopened this month; I’ve asked engineering for a root cause and will update you Thursday.” A good message would make sense even if the customer had never been scored.
Measuring intervention quality beyond “saved”
Counting saves counts customers who would have stayed anyway. Track:
- Incremental retained revenue vs. holdout (primary)
- Uplift by action and segment
- Save durability: churn at 6 and 12 months among treated customers who stayed
- Post-intervention health: usage and seat trajectory at 90 days
- Discount leakage: discount spend on customers comparable to holdout accounts that renewed without one
- Time-to-first-action and override rate and accuracy
- Sleeping-dog rate: churn among treated low-risk customers vs. their holdout
A maturity ladder
Many uplift articles imply that anything short of randomization plus an uplift model is worthless. I disagree. [Judgment.] Each level is useful on its own.
| Level | You have | Do | Measurement | Stay here when |
|---|---|---|---|---|
| 0: Rules and conversations | CRM, usage logs, a few dozen churn events a month or fewer | 3–5 transparent rules; interview every departing customer | Descriptive only | Volume is too low for a model to beat rules plus conversations (rule of thumb, not a tested threshold) |
| 1: Risk model vs. rules baseline | 12+ months of clean snapshots | Time-split model; calibration; keep only if it beats Level 0 at capacity | Precision at capacity, calibration, drift | Interventions are cheap and rarely harmful (e.g., fix-the-bug workflows) |
| 2: Randomized holdout, risk-ranked | Level 1 plus willingness to withhold outreach from a random slice | Randomly hold out 10–20% of flagged accounts; log arm, action, outcomes at 30/60/90 days. Start before you have a model, using rule-based flags | Average effect of the program, and of each action where volume permits | You lack the volume for heterogeneity estimates |
| 3: Uplift targeting | Randomized data across enough treated and untreated customers per action | Estimate uplift on randomized data; rank by uplift × margin; cap at capacity; keep a persistent holdout | Incremental retained revenue, uplift by segment, drift | (Target state) move here when Level 2 shows heterogeneous effects |
Level 2 is the highest-value step. It converts opinion into evidence without stopping current work. Do not skip it to reach Level 3. Historical outreach is a poor substitute for randomization, because account managers called the accounts they were worried about, so treated and untreated groups differed before any call. Uplift models trained on such data can encode that selection bias. Treat any observational estimate as a hypothesis. [Inference.]
Illustrative cases
All seven cases below are composites with invented numbers, built from the stated assumptions. They show mechanics and plausible ranges, not observed data. Case 1’s direction rests on the published experiments above.
Case 1: Risk-ranked targeting that loses money
The worked example above: 1,000 contacts at an assumed 1.5-point uplift, −$6,000 net. The public analogue is the carrier experiment, where treated customers churned at roughly 10% vs. 6% for controls. [Illustrative / Evidence, secondary.]
Case 2: A rules baseline that nearly matches a model (consumer-scale) [Illustrative]
- 20,000 subscribers, 2.5% monthly churn → ~500 churners; capacity 200 accounts a month
- Rules list: precision@200 = 31% (62 churners). Model list: 36% (72 churners)
- C = $20; V = $900; assumed holdout-measured uplift of 5.0 points (rules) and 5.5 points (model)
| Approach | Saves | Revenue | Cost | Net |
|---|---|---|---|---|
| Rules | 10 | $9,000 | $4,000 | $5,000 |
| Model | 11 | $9,900 | $4,000 | $5,900 |
The model’s edge is about $900 a month, before the cost of building and running it.
Case 3: A B2B pilot too small to read [Illustrative]
- 300 logos, ACV $60,000, 80% gross margin → V ≈ $48,000; annual logo churn 9% (~27 logos)
- Executive-sponsor intervention costs $3,000 per account → break-even uplift 6.25 points
- 40 flagged accounts, randomized 20/20; holdout churn 6 of 20 (30%), treated 3 of 20 (15%)
A 15-point gap looks like a win. On 20 vs. 20 accounts, it is consistent with chance. If real, three extra saves × $48,000 = $144,000 against $60,000 of cost. The honest read is “promising, unproven.”
Case 4: A hybrid that routes by diagnosis [Illustrative]
8,000 mid-market accounts; the model flags 400 a month; reason codes split the list 40% support friction, 35% narrow usage, 15% price signal, 10% champion change. Rules assign fix, teach, offer (only with a price signal), and human touch. A 15% holdout runs throughout. After two quarters the team retires discounts for accounts with no price signal, because measured uplift is below break-even, and shifts budget to fix. No new model was needed; the measurement stage found the leak.
Case 5: Rules vs. model in mid-market B2B [Illustrative: composite constructed to plausible mid-market B2B SaaS ranges; not observed data]
Setup. 2,400 accounts on annual contracts; 600 come up for renewal in the quarter; 12% non-renewal → ~72 expected churners. The CS team can run 60 structured interventions a quarter.
Rules list: seat utilization below 50% of licensed seats and (sponsor change or two or more P1 tickets in 60 days). Flags 60 accounts; 22 churn → precision@60 = 37% (3.1× the 12% base rate; recall 31%).
Model list: gradient-boosted model, ~40 features. Top 60 contains 26 churners → precision@60 = 43% (3.6× base; recall 36%). The two lists overlap on 41 of 60 accounts.
Economics. C = $1,200 (CSM, solutions-engineer, and some executive time); ACV $18,000 at 78% gross margin → V ≈ $14,000. Break-even uplift = 1,200 ÷ 14,000 ≈ 8.6 points.
Assumed uplift (from pooled holdout data): 9.5 points on the rules list, 10.0 on the model list, both above break-even.
| Approach | Saves | Margin retained | Cost (60 × $1,200) | Net per quarter |
|---|---|---|---|---|
| Rules | 5.7 | $79,800 | $72,000 | $7,800 |
| Model | 6.0 | $84,000 | $72,000 | $12,000 |
The model’s precision advantage is real (6 points). Its economic edge is about $4,200 a quarter, roughly $17,000 a year. Because both lists run close to break-even, small differences matter in relative terms but are small in absolute dollars. If building and running the model costs more than that, rules win. The uplift figures here are assumed; in practice, the larger risk is that neither list clears break-even, which only a holdout reveals.
Case 6: B2B measurement under small samples [Illustrative: composite constructed to plausible mid-market B2B SaaS ranges; not observed data]
Setup. 450 logos, annual contracts spread across the year, ~110 renewals a quarter, ~10% non-renewal → ~11 churners a quarter. The team flags about 30 accounts a quarter; flagged accounts churn at roughly 35%.
The constraint. By the formula in the next section, detecting a drop from 35% to 20% needs about 135 accounts per arm (~270 total). At 30 flagged accounts a quarter, that is roughly nine quarters of data. A clean renewal-only readout is out of reach.
What the team did.
- Randomized 2:1 treatment to holdout within strata (ACV tier × owning CSM), so no single large account or CSM dominated one arm.
- Held out only discretionary actions (optional executive outreach). Known defects were always fixed in both arms.
- Pre-registered a leading outcome, change in seat utilization at 90 days, as the primary measure, with renewal as a confirmatory secondary.
- Pooled four quarters with a persistent holdout: 80 treated, 40 held out.
What they saw. Non-renewal: 22 of 80 treated (27.5%) vs. 14 of 40 held out (35%). The 7.5-point gap has a standard error of roughly 9 points, so it is well within noise. Seat utilization trended higher among treated accounts.
What they concluded. “Directionally positive on the leading indicator, unproven on renewal.” They kept the holdout, did not report a dollar ROI, and restricted next-quarter spend to the actions with the best leading-indicator movement. They validated the leading indicator against historical renewals before leaning on it.
Case 7: The model’s edge that vanished under a time split [Illustrative – composite constructed from patterns commonly observed in mid-market B2B SaaS retention programs; not a real company’s data]
Setup. 3,000 accounts on annual contracts; ~800 renew in the quarter; ~11% non-renewal → ~88 expected churners. The CS team can run 50 structured interventions a quarter.
The validation surprise. The data science team’s first model looked clearly better than the rules on a random row split. They re-ran it with a time split (train on earlier quarters, test on the latest) and found two features, such as days since last admin login, were partly encoding outcomes already in motion. After removing them and splitting by time, the gap closed.
Rules list (seat utilization under 50% and sponsor change or two or more P1 tickets in 60 days): 50 flagged, 19 churn → precision@50 = 38% (3.5× base). Model list (time-split): 17 of 50 churn → 34%. The lists overlap on 33 of 50. Two accounts either way is noise; the honest summary is “no demonstrated advantage,” and rules are cheaper to run and explain.
Economics. C = $1,500; ACV $24,000 at 77% gross margin → V ≈ $18,500. Break-even uplift = 1,500 ÷ 18,500 ≈ 8.1 points.
The holdout. Two quarters of the rules-list program, 80 treated and 20 held out: non-renewal about 31% vs. about 38%, a 7-point gap with a standard error of roughly 12 points. That is compatible with a harmful program and with a large benefit.
| Reading of the 7-point estimate | Saves (50 contacts) | Margin retained | Cost (50 × $1,500) | Net |
|---|---|---|---|---|
| Point estimate, taken at face value | 3.5 | $64,750 | $75,000 | −$10,250 |
What they concluded. The point estimate sits below break-even and the interval is too wide to act on in either direction. They did not declare the program a success or a failure. They (1) kept the rules list and shelved the model until it beats rules on time-split precision, (2) kept the holdout, and (3) split the action menu by cost. Low-cost fix-first contacts on the P1-ticket subset (assumed C ≈ $400, break-even ≈ 2.2 points) continued for all flagged accounts, since a known defect is never withheld. The $1,500 executive-touch action stayed under the holdout until evidence clears its 8-point bar.
B2B, long cycles, and high-LTV accounts
1. Sample size is the binding constraint
For a two-arm test on churn rates at 80% power and a two-sided 5% significance level:
n per arm ≈ 7.84 × [p₁(1−p₁) + p₂(1−p₂)] ÷ (p₁−p₂)²
| Scenario | Per arm |
|---|---|
| 6% → 5% (consumer-scale, one point) | ≈ 8,100 |
| 6% → 3% (halved churn) | ≈ 745 |
| 10% → 5% (annual B2B logo churn, halved) | ≈ 431 |
| 35% → 20% (flagged B2B accounts, Case 6) | ≈ 135 |
Options when you cannot reach those numbers: pool cycles with a persistent holdout; stratify the randomization; use a leading outcome and treat renewal as confirmatory; and say so out loud rather than report saves you cannot verify.
2. Weight by revenue, not logos
Track logo retention and net revenue retention, and compute uplift in dollars. One large renewal can swing a quarter.
3. Use leading outcomes, with discipline
Candidates: seat-utilization trend (active ÷ licensed seats), time-to-value for new accounts, expansion and feature breadth, executive engagement. Treat these as proxies and validate them against your own renewal history first. The surrogate problem is the one Huang & Ascarza address. [Evidence, secondary, for the problem as framed in their abstract; your proxy’s validity is yours to establish.]
4. The economics favor action more often, and learning is harder
At ~$48,000 of margin per logo, even a $3,000 intervention has a break-even uplift of about 6 points. The risk shifts from wasting spend to failing to learn. A reasonable compromise: hold out only where the action is discretionary, and never withhold a fix for a known defect. [Judgment.]
Cancellation flows are a different, regulated problem
Verify before you rely on this section. The status below reflects the most recent sources I found (autumn 2026), and rules in this area have changed repeatedly. It is orientation, not legal advice, and I am not a lawyer. Check the FTC’s negative option rule page and your states’ automatic-renewal laws directly, and consult counsel before acting.
On July 8, 2025, the Eighth Circuit vacated the FTC’s 2024 “click-to-cancel” amendments on procedural grounds (Custom Communications, Inc. v. FTC, 142 F.4th 1060, cited in the FTC’s later notice; see also this summary).
The FTC then restarted with an advance notice of proposed rulemaking, announced March 11, 2026, and published in the Federal Register on March 13, 2026 (91 FR 12318). Comments closed April 13, 2026. The notice states that the existing rule applies only to prenotification plans for goods. [Evidence, primary.]
Practitioner summaries report that the notice asks about cancellation flows and “save” offers, including acceptance rates and delays to cancellation (Kelley Drye), and that it contains no draft rule text (Troutman Pepper Locke). [Evidence, secondary.]
As of a September 2026 secondary source, no proposed rule had been published. [Evidence, secondary, vendor blog; I found nothing newer.]
State automatic-renewal laws also apply, and some cover save attempts. [Evidence, secondary; verify the laws for your states.]
My judgment as an analyst: keep the loop’s interventions on the pre-decision side. Make cancellation simple and let the model’s value come from earlier, useful contact. A retention system that relies on obstruction carries regulatory risk that no uplift calculation offsets. [Judgment.]
What to do on Monday: a 30/60/90-day plan
Days 1–30: Foundation
- Define the label. Voluntary vs. involuntary; for annual contracts, the earliest observable decision proxy. Set the horizon after measuring your latency budget.
- Pull 12 months of snapshots, with features computed as of each date.
- Examine these first: usage slope vs. the account’s own baseline; seat or feature breadth change; reopened high-priority tickets; failed payments or seat reductions; champion or admin departure.
- Exclude late signals.
- Build the rules baseline and measure precision at your weekly capacity.
- Stand up a minimal holdout today. You do not need a model. Each cycle, give every rule-flagged account a seeded random draw by account ID, log the arm in your CRM, and have CSMs work only the treatment arm. Start at 10–20%. For high-ACV accounts, hold out only discretionary actions.
Days 31–60: Instrument and model
- Log everything: score or flag, arm, action, owner, time-to-first-action, 30/60/90-day outcomes, override reasons.
- Train the risk model on time-split data. Check calibration. Keep it only if it beats the rules at capacity.
- Write the action menu and map reason codes to default actions.
- Run the sample-size check for your base and write down which effect sizes you can and cannot detect.
Days 61–90: Learn
- Read the first holdout results with humility. Report effect sizes with intervals. If the base is small, say “not yet detectable.”
- Compute break-even uplift (C ÷ V) per action and compare it with measured uplift where data allow.
- Retire actions with clearly negative economics.
- Choose your next ladder level deliberately, including staying put.
Leading indicators to watch weekly
Time-to-first-action; share of flagged accounts actually contacted vs. capacity; treated and holdout churn side by side; seat-utilization trend among treated accounts; override rate.
Red flags that the current approach may be net-negative
- Treated churn exceeds holdout churn, even if not yet significant.
- The internal “save rate” has no holdout behind it.
- Discount spend rises while comparable holdout accounts renew without one.
- Flagged accounts churn faster after a templated email.
- Nobody can state the cost per contact.
- Model precision at capacity is no better than the rules baseline on a time-split test.
- Cancellation friction is increasing to hit a save-rate target.
Limitations & open questions
What this article does not establish
- Effect sizes are context-specific. The published experiments are from telecom and membership settings. I know of no equivalent public randomized evidence for B2B SaaS retention programs, and I would be skeptical of anyone quoting a universal uplift figure.
- Source depth varies, and none of the three key papers was reviewed in full text.
- Ascarza, Iyengar & Schleicher (2016): I reviewed the Columbia abstract, Columbia’s press release, and Wharton Knowledge. The 6% and 10% churn figures and the two proposed mechanisms come from those summaries. I did not verify the full methods, sample construction, or robustness checks.
- Ascarza (2018): I reviewed the AMA’s 2023 summary and award descriptions. I did not review the experimental designs or effect sizes in the paper itself, so the claim that risk-based targeting sometimes increased churn rests on that summary.
- Huang & Ascarza (2024): I reviewed the abstract only. I did not assess the surrogate-index assumptions or the real-world application’s details.
- Ascarza, Netzer & Hardie (2018): cited by title and venue only.
- Check the papers before citing them in a decision document.
- All case numbers are invented. They show mechanics and plausible ranges. Your precision, uplift, cost, and margin will differ, in either direction.
- The ladder’s thresholds are rules of thumb, not tested cutoffs.
- Regulatory content ages fast. Confirm current FTC and state status and consult counsel.
Open questions
What changes when AI agents deliver the outreach? I am not aware of strong public randomized evidence comparing agent-delivered and human-delivered retention contact, so what follows are questions, not findings.
- Cost and the break-even rule. If agent contact pushes C toward zero, the break-even rule loosens on paper. But the carrier experiment shows contact can itself raise churn, and attention and trust costs do not appear in C. Does cheap contact scale the backfire along with the volume?
- Measurement. If an agent generates many message variants, each variant becomes another arm competing for the same small sample. How should teams trade learning speed under adaptive allocation against clean effect estimation? Could multiple contacts at one B2B account interfere with each other, making account-level randomization necessary?
- Context and accuracy. A human CSM’s judgment about whether to call at all is part of today’s intervention. What happens when an agent states wrong account facts or promises something the company cannot deliver, a failure that no churn metric captures? How should error rates be monitored and capped?
- Regulatory exposure. The FTC’s notice reportedly asks about save attempts in cancellation flows. Where is the line between helpful pre-decision outreach and in-flow persuasion, and how should an agent be kept on the right side of it?
- Human-in-the-loop design. For high-ACV accounts, should agents draft and humans send? Does that preserve the benefit while limiting the risk?
How much of the backfire effect is content vs. the act of contact? Tests that vary message content while holding contact constant would help.
How stable are leading indicators such as seat utilization as renewal predictors across B2B segments and over time?
What is the minimum volume at which an uplift model beats well-designed rules? I offered a rule of thumb, not a result.
A churn score tells you who is leaving. Only a holdout group tells you whether you were the reason they stayed.
