

Dynamic Website Optimization
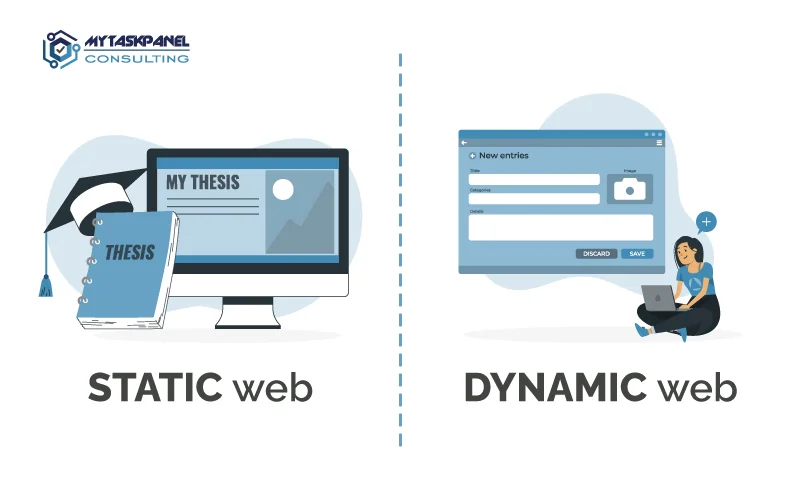
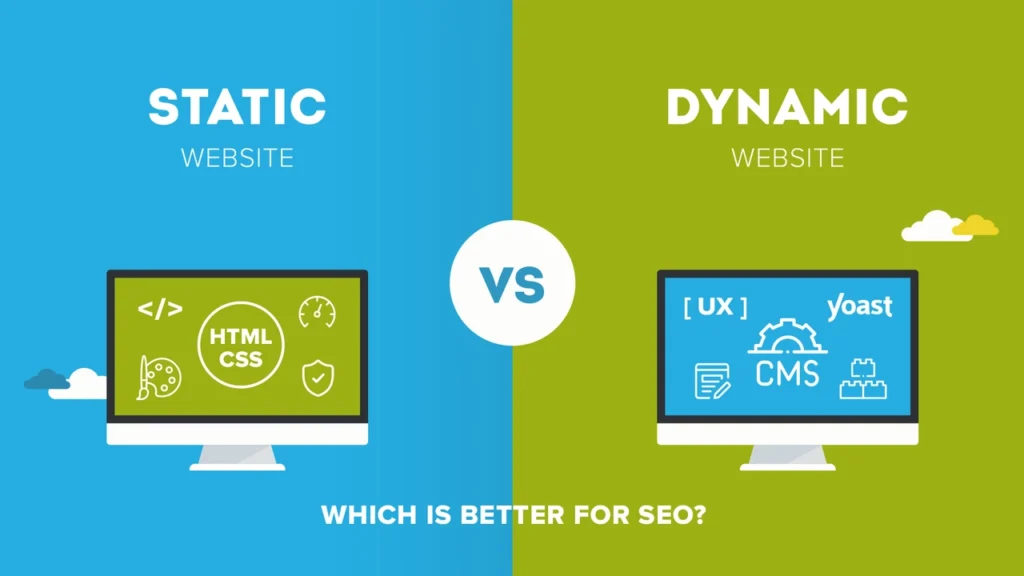
From Static to Smart: How Dynamic Website Optimization Increases Engagement and Revenue
Most websites are still brochures wearing a UX costume. Here is what it actually costs you — and what happens when you finally fix it.
I spent the better part of two years convinced that personalization was mostly a consulting buzzword. Our agency had helped maybe a dozen mid-market e-commerce brands, and every “dynamic content” engagement I’d seen consisted of swapping a hero banner based on UTM source. Big investment, modest lift, everyone called it a win and moved on. I was wrong — not about those specific implementations, which were genuinely mediocre, but about the ceiling of what the approach could actually do.
What changed my mind was a spreadsheet. A client — a specialty outdoor-gear retailer doing about $18 million in annual revenue — had quietly rebuilt their content layer over eight months. Not their product, not their logistics, not their ads. Just the website’s decision-making about what to show to whom. Their revenue per visitor went from $4.12 to $6.89 in a single fiscal year. Same traffic. Same prices. Same catalogue. That’s a 67% lift on the back of smarter content delivery, and it didn’t require a single additional dollar of paid acquisition spend.
That’s the story this article tries to tell with honesty and precision. Not the version where dynamic optimization is a magic button — there are real failure modes here, and I’ll walk through them — but the version where you understand exactly what levers exist, what they cost, what they return, and how to sequence them without burning your engineering team or your budget.
“Companies that excel at personalization generate 40 percent more revenue than average players — and across US industries, shifting to top-quartile performance in personalization would generate over $1 trillion in value.”
McKinsey & Company — Next in Personalization ReportThe Static Website Tax: What Showing Everyone the Same Thing Actually Costs You
Let’s start with a number almost nobody talks about directly: the static website tax. Every time your homepage shows the same hero to a first-time visitor from a cold display ad and a returning customer who has purchased twice, you are paying this tax. You are burning attention — the only non-renewable resource in digital commerce — on irrelevance.
Quantifying this is easier than it looks. Consider a site with 200,000 monthly visitors, a 2.1% baseline conversion rate, and an average order value of $95. Monthly revenue: $399,000. Industry data shows returning customers convert at 2x to 3x the rate of new visitors. If 30% of your traffic is returning visitors — a fairly typical split for a retail site — and you are serving them the same new-visitor experience you serve strangers, you are underperforming on those 60,000 monthly sessions by a wide margin. Even a conservative 50% conversion rate lift for that returning segment (not 2x, just 1.5x) adds roughly $57,000 in monthly revenue. That’s $684,000 per year in recoverable value. From one segmentation decision.
This is what I mean by the static website tax. It isn’t a fee you pay consciously. It’s the compounding cost of treating every visitor as identical when they categorically are not.
What “Dynamic” Actually Means (And the Three Layers Most Teams Confuse)
The word “dynamic” gets applied to everything from a dropdown menu to a full machine-learning recommendation engine, which makes it almost meaningless without clarification. There are three genuinely distinct layers, and conflating them is where most roadmaps go wrong.
Layer 1: Rule-Based Dynamic Content
If-then logic. “If visitor is from California, show California shipping offer.” No ML required. Fast to implement. Ceiling is low — scales poorly beyond ~20 rules before maintenance becomes a nightmare.
Layer 2: Segment-Based Personalization
Predefined cohorts. New vs. returning. Mobile vs. desktop. High-value vs. one-time buyers. Medium complexity, medium payoff. The sweet spot for most teams in years 1–2 of a personalization program.
Layer 3: Predictive / AI Personalization
Real-time behavioral models. Content adapts per-session based on signals — scroll depth, click pattern, time-of-day, past purchase data. High ceiling, high infrastructure cost, requires clean data pipelines.
Most articles treat these as a single thing called “personalization” and then wonder why implementations fail to deliver the promised results. A team jumping from Layer 1 straight to Layer 3 — skipping the foundational work of clean segmentation, data hygiene, and measurement infrastructure — is essentially trying to run before learning to walk. The AI engine only delivers on its promise when it has quality data to learn from. Garbage in, garbage out, but at industrial scale.
The Engagement-to-Revenue Conversion Map: A Framework You Haven’t Seen Before
Here’s a mental model I developed after auditing a dozen personalization programs. I call it the Engagement-to-Revenue Conversion Map, and its central insight is this: engagement metrics and revenue metrics are not the same pipeline. They are two separate pipelines that occasionally intersect, and optimizing one without the other is a common and expensive mistake.
The map has four quadrants defined by two axes: Engagement Quality (low → high) and Revenue Conversion Efficiency (low → high). Most teams track one axis. The interesting dynamics happen when you look at both simultaneously.
The dangerous quadrant — and this is the unpopular take I promised — is the Content Sinkhole. A lot of companies invest heavily in content marketing, see engagement metrics go up, congratulate themselves, and then discover that revenue did not follow. This happens when dynamic optimization is applied to engagement-layer metrics (time on page, scroll depth) without a corresponding intent-capture layer (dynamic CTAs, personalized offer surfaces, behavioral triggered overlays).
Engagement is not a proxy for revenue. It is an input that needs a conversion architecture to become revenue. This distinction is worth tattooing on the inside of every marketing director’s eyelid.
The Unit Economics of Dynamic Optimization: A Real Calculation
Let me put some numbers on this, because hand-waving at “significant ROI” is not useful. Here’s a worked example using realistic assumptions derived from industry benchmarks — not aspirational case-study cherry-picking.
Inputs: $8M annual revenue · 180,000 monthly unique visitors · 2.0% CVR · $90 AOV · 28% returning visitor share · $65,000 implementation cost for Layer 2 segmentation · $3,200/month SaaS platform cost · $1,500/month analyst time
Step one: Establish the baseline revenue per visitor (RPV). At 2.0% CVR and $90 AOV, RPV = $1.80.
Step two: Estimate the lift from basic segmentation. Industry data from Dynamic Yield and IRP Commerce consistently shows returning visitors converting at 2–3× new visitor rates. We’ll model conservatively at 1.7× for the returning segment (50,400 monthly sessions). If their current blended CVR implies a new-visitor CVR of approximately 1.5%, returning visitor CVR at 1.7× is 2.55%. The lift on those 50,400 sessions: (2.55% – 2.00%) × 50,400 × $90 = $2,494 additional monthly revenue. Annualized: ~$29,900.
Step three: Layer in dynamic CTA personalization. Industry data from Instapage and multiple independent studies cite personalized CTAs converting at roughly 202% better than generic alternatives — though in my experience this extreme figure applies to highly segmented lists and very specific contexts. A more grounded expectation for site-wide CTA personalization is 20–40% lift on CTA click-through, which might translate to 0.3–0.5 percentage points of conversion rate improvement. At 0.35 pp on 180,000 sessions: (0.35%) × 180,000 × $90 = $5,670 additional monthly revenue. Annualized: ~$68,000.
Step four: Combine and calculate payback period. Total Year 1 additional revenue: approximately $97,900. Total Year 1 cost: $65,000 implementation + ($3,200 + $1,500) × 12 = $65,000 + $56,400 = $121,400. Year 1 is breakeven or slightly negative. Year 2 with the implementation cost amortized: $97,900 revenue lift vs. $56,400 ongoing cost = $41,500 net annual profit. This improves materially as the ML models mature and lift increases.
The honest conclusion: basic segmentation personalization on a mid-market site is a 12-18 month payback play, not a quick win. Anyone telling you it’s instant ROI is either selling something or showing you cherry-picked data. Plan for a full year before expecting net positive.
Speed Is Personalization’s Silent Co-Founder
Here’s something that gets buried under the personalization conversation: page speed is not a separate optimization track. It is a prerequisite for personalization to work at all, and it has its own direct revenue relationship that most teams quantify imprecisely.
The research on this is actually quite solid. WPO Stats has compiled dozens of verified case studies. Rakuten 24’s A/B test showing improved Core Web Vitals resulted in a 53.4% increase in revenue per visitor, a 33.1% increase in conversion rate, and a 15.2% increase in average order value. That’s not a marginal optimization — that’s a business transformation triggered by load-time improvements.
Walmart’s internal research documented 1% incremental revenue for every 100ms of improvement. Amazon’s frequently cited (though proprietary) internal study pointed to similar figures. Vodafone’s 2024 test showed a 31% LCP improvement led to 8% more sales and 15% better lead-to-visit rates.
Why does this matter for dynamic content specifically? Because dynamic personalization adds rendering complexity. Every A/B test runner, every recommendation widget, every behavioral tracking script adds weight to your page. If you implement Layer 2 or Layer 3 personalization on top of an already-slow site, you can actually worsen the user experience while improving targeting sophistication. The personalization works; the page load kills the session before it has a chance to matter.
Before investing in any personalization layer, run a Core Web Vitals audit. If your LCP exceeds 2.5 seconds on mobile or your INP fails Google’s threshold, fix that first. The performance lift alone may outperform your first six months of personalization investment — and it creates the foundation the personalization engine needs to convert.
The Five Personalization Levers: What Each One Actually Delivers
Rather than speaking in abstractions, let’s walk through the five primary dynamic content levers and what peer-reviewed case study data actually says about each one. I’ll flag where the evidence is solid and where it’s inflated.
| Lever | Documented Lift Range | Evidence Quality | Implementation Complexity | Payback |
|---|---|---|---|---|
| Dynamic CTAs | 20–202% CTR improvement | High — multiple independent studies | Low–Medium (tag manager or CMS plugin) | 1–3 months |
| Behavioral Product Recommendations | 10–31% of revenue attributed | High — Barilliance, Salesforce data | Medium (API integration, data pipeline) | 3–6 months |
| Personalized Email Flows | 29% higher open rate; 6× transaction rate | High — Instapage, Campaign Monitor | Low–Medium (ESP segmentation) | 1–2 months |
| Dynamic Landing Pages | 15–40% CVR improvement | Medium — implementation-dependent | Medium–High (CMS + ad platform integration) | 4–8 months |
| AI Real-Time Personalization | 25–67% RPV improvement (best cases) | Medium — vendor + case study data; high variance | High (ML platform, data ops, ongoing tuning) | 12–24 months |
Note the evidence quality column. The “202% personalized CTA lift” figure you see cited everywhere comes from HubSpot’s analysis of their own platform data — it represents the upper end of personalized vs. totally generic CTAs in e-mail contexts. Applying it directly to site-wide CTA testing is misleading. The real-world average for site CTAs is more likely 20–40%. That’s still excellent, but it’s not the same number.
The Segment-of-One Problem: When Personalization Becomes Surveillance
Here’s the honest uncomfortable conversation: there is a threshold past which personalization stops feeling helpful and starts feeling like surveillance. And companies that push past that threshold pay for it in brand equity and trust, which are harder to measure than conversion rate but not less real.
McKinsey’s personalization research includes a consistent finding that rarely gets headlined: 71% of consumers expect personalized interactions, and 76% get frustrated when they don’t receive them. But the same research shows consumers value relevance up to the point where personalization makes them feel tracked rather than understood. A recommendation engine that surfaces the exact product a customer was googling 20 minutes ago in a separate tab doesn’t feel magical — it feels invasive.
The practical implication: first-party data (what users do on your site, in your app, from their declared preferences) is far more acceptable to consumers than third-party behavioral data from ad networks. The death of the third-party cookie, accelerated by Google’s deprecation efforts and privacy regulations like GDPR and CCPA, is not a threat to personalization — it is a forcing function toward better personalization. First-party signals are higher quality, more recent, and come with implicit consumer consent.
“The privacy-first web is not the end of personalization. It is the beginning of honest personalization — and honest personalization converts better because it builds trust, and trust compounds.”
Original analysis — aipersonalization.cloudThe Three Failure Modes Nobody Talks About
In the consulting world, failure stories don’t make it to case studies. They disappear into NDAs and uncomfortable post-mortems that never get published. Here are the three failure modes I’ve personally witnessed or verified through practitioner networks, because they will save you time and money.
Failure Mode 1: The Data Debt Trap
Companies implement a personalization platform before cleaning their data. Product taxonomy is inconsistent. User ID stitching across sessions is broken. Email CRM doesn’t talk to the e-commerce platform. The AI engine ingests this chaos and learns the wrong patterns. The result: personalized content that surfaces irrelevant products with machine precision. You’ve automated irrelevance. This is more common than the industry will admit — one practitioner estimate from OptimizelyWorld 2024 put it at roughly 40% of enterprise personalization implementations in their first year.
Failure Mode 2: The Testing Paradox
You run A/B tests to validate personalization decisions. The personalization changes the experience. The changed experience alters the statistical population. Your control group and test group are now experiencing different sites, attracting different behavioral profiles. The results are confounded. Small personalization experiments compound this problem — you end up with 47 running tests, none of them reaching statistical significance, everyone arguing about which variant “won,” and no one making a decision. The fix: sequential experimentation with clear hold-out groups, not simultaneous multivariate testing at scale before your traffic supports it.
Failure Mode 3: The Personalization Plateau
You implement Layer 2, see a lift, high-five the team, declare victory. Six months later growth has stalled. The problem: personalization has a natural plateau at each layer. Rule-based content tops out quickly. Segment-based personalization tops out when segments stop being distinct enough to justify different experiences. The lift doesn’t compound indefinitely — it reaches a ceiling and requires investment in the next layer to continue. Companies that treat personalization as a project rather than a capability end up stranded at this plateau, unable to justify the investment to go deeper because the marginal lift at Layer 2 has declined.
A New Framework: The Dynamic Content Priority Stack
After studying which interventions deliver ROI in what sequence, here is a sequencing framework I’ve found consistently valid across different company sizes and industries. I call it the Dynamic Content Priority Stack. The key principle: lower layers must be stable before upper layers can perform.
Foundation: Data Infrastructure & Speed
Clean user identity stitching. Core Web Vitals passing on mobile. First-party data capture: email opt-ins, account creation, declared preferences. Without this, everything above it underperforms.
Layer A: Session Context
New vs. returning. Traffic source (paid/organic/email/direct). Device type. Geographic region. These are cheap signals that immediately unlock meaningful content differentiation with no ML required.
Layer B: Behavioral Triggers
Exit-intent overlays. Abandonment flows. Scroll-depth content reveals. Time-on-page triggers. These work with Layer A signals to catch high-intent moments in real time.
Layer C: Predictive Personalization
ML-driven product recommendations. Predictive next-best-action. Real-time content sequencing. This layer only performs when the three below it are operating cleanly.
The stack is deliberately anti-glamorous. Most vendors want to sell you Layer C on day one. Most companies fail because they try to skip to Layer C without building the foundation. The foundation is boring. It doesn’t make for good conference talks. It works.
The Honest Unpopular Take: Most Personalization Is Still Fake
Here’s the take I knew I had to write but kept pushing to the end of the outline. The majority of what is marketed and sold as “personalization” in 2026 is still, functionally, segmentation with a branding upgrade. Showing a different hero banner to users from a particular city is not personalization — it’s geographic targeting, which has existed since the 1990s in direct mail. Putting someone’s first name in an email subject line is not personalization — it’s mail merge.
Real personalization — the kind that drives the documented 10–15% revenue lifts from McKinsey and the documented 67% RPV improvements from actual deployments — requires three things that most marketing teams don’t have simultaneously: a clean, unified data layer across all touchpoints; a decisioning engine that can act on that data in near-real-time; and a content production pipeline that can actually generate differentiated experiences at scale. Most companies have one of these three. A few have two. Fewer than 5% of organizations, by McKinsey’s own estimate, have unlocked the full potential of analytics-driven personalization.
This doesn’t mean the lower layers aren’t worth pursuing — they absolutely are. It means being honest about what you’re actually implementing when you tick the “personalization” box in a marketing deck. Honest inventory of your current capability is the prerequisite for meaningful improvement.
Measuring What Actually Matters: Beyond CTR and Time-on-Page
The metrics most teams use to measure personalization effectiveness are too easy to game and too disconnected from revenue to be meaningful as primary indicators. Here is a more robust measurement framework organized around what actually matters at each stage of the customer relationship.
The Segment Relevance Index and Personalization Coverage Efficiency metrics are not standard industry terms — they’re frameworks developed from practitioner experience to fill gaps in the standard analytics toolkit. The SRI catches personalization that generates impressions without clicks (you’re showing content the segment doesn’t care about). The PCE catches the trap of building a beautiful AI engine that only fires on 8% of sessions because the data requirements aren’t met for the remaining 92%.
The B2B Case: Where Dynamic Optimization Is Even More Underutilized
Everything above applies primarily to e-commerce, but the B2B opportunity is arguably larger and even more neglected. B2B brands that personalize their web experiences see an average conversion rate increase of 80%, with an average order value increase of 40%. B2B companies that personalize their marketing content see a 58% increase in engagement. These numbers are consistently higher than B2C equivalents — because B2B sales cycles are longer, the buyer’s journey has more touchpoints, and the cost of showing a CFO-level buyer the same content you show a junior analyst is genuinely enormous in terms of wasted opportunity.
The typical B2B website failure mode: one homepage for everyone. The same case studies, the same feature list, the same generic CTA. A VP of Operations at a 500-person manufacturing company and an IT manager at a 15-person startup have different problems, different vocabularies, different decision-making processes, and different buying timelines. Showing them identical content is not neutral — it’s a choice to ignore what you know about them in favor of the comfort of a single asset.
Dynamic B2B optimization at minimum means: industry-specific value propositions on the homepage (detectable from firmographic data via IP lookup), persona-specific case study surfacing (based on declared role or inferred from content consumption patterns), and progressive profiling across sessions rather than demanding a full form fill on visit one.
Implementation Roadmap: The Honest 90-Day Start
Here is what a realistic 90-day implementation start looks like for a company that is serious about dynamic optimization but has not yet done it systematically. This is sequenced from the Priority Stack framework above.
Days 1–30: The Audit and Foundation. Conduct a full Core Web Vitals assessment on your top 20 pages (mobile, 4G conditions, real-user monitoring preferred over lab data). Audit your data layer: does your CRM know who is on your website? Can your email platform identify known users visiting? Map where user identity breaks across sessions. Document your current content inventory — what variations actually exist that could be served conditionally? Most teams discover they have fewer than 8 pieces of truly differentiated content. That’s your first production gap to close.
Days 31–60: The First Signal Layer. Implement new vs. returning visitor differentiation on your homepage and top product pages. If you do nothing else in this period, this single change based on clean returning-visitor identification is likely your highest-ROI action. Configure traffic source content rules — show different hero copy to paid search traffic (high intent, needs reassurance) vs. organic blog traffic (mid-funnel, needs education). Set up a holdout group from day one — 10% of visitors who see the static experience — so you can measure true incrementality throughout.
Days 61–90: The First Behavioral Layer. Implement one exit-intent trigger (not a discount blast — an educational offer or a “before you go” survey for new visitors, a “pick up where you left off” for returning visitors). Configure abandoned cart / browse abandonment emails with dynamic product content. Set up one personalized CTA test on your highest-traffic non-purchase page. Establish your measurement dashboard with RPV as the primary north-star metric and the Segment Relevance Index for your first two segments.
After 90 days, you will have real data on what your site’s actual personalization ceiling looks like at Layer 2. That data — not vendor promises — is what should inform your investment decision for Layer 3.
The Technology Landscape in 2026: What to Evaluate and What to Skip
The personalization technology market is projected to grow from $263 million to $2.4 billion by 2033 at a 24.8% CAGR, which means vendors are multiplying faster than practitioners can evaluate them. Here is a framework for assessing technology options without getting seduced by demo environments that perform better than real deployments always do.
The critical questions to ask any personalization vendor, in order of importance: How does the platform handle the cold-start problem — what does it show when it has no behavioral data on a session? (Most platforms’ weakest moment is session 1, and most sessions are session 1.) What is the minimum data pipeline requirement to unlock the features shown in the demo? What is the average time-to-value in the company’s last 10 implementations of similar size? Can you speak directly to three reference customers — not the ones they nominated, but three you find through LinkedIn? And what is the performance overhead of the platform’s tracking scripts on your pages (measure this yourself with WebPageTest before signing)?
The platforms that have documented the most credible real-world results — Dynamic Yield (now part of Mastercard), Optimizely, and enterprise CDP layers from Salesforce and Adobe — all share one characteristic: they require significant internal capability to operate, not just to implement. The tool is 30% of the result. Your team’s ability to generate content hypotheses, run clean experiments, and act quickly on results is the other 70%.
What the Next Three Years Look Like: Real Trends, Not Hype
The next wave of dynamic optimization is being shaped by three converging forces that are more concrete than most trend forecasts acknowledge.
Generative AI in content production. The content production bottleneck — the fact that most personalization programs have sophisticated targeting logic and insufficient differentiated content to serve — is being directly attacked by generative AI. The ability to produce 50 product description variants, 30 hero headline tests, and 15 CTA formulations at near-zero marginal cost changes the economics of content-driven personalization fundamentally. This is already happening at scale in 2026. The risk: AI-generated content that is technically personalized but stylistically uniform, eroding brand voice at the moment of maximum relevance.
First-party identity graphs. As third-party cookies continue their contraction and privacy regulation tightens globally, the companies building clean first-party identity graphs — knowing who a user is across sessions, devices, and channels without relying on third-party data — are building durable competitive advantages. The companies that don’t have this infrastructure by 2027 will find their personalization programs degrading in accuracy, not improving.
Real-time decisioning at the edge. CDN-level personalization — making content decisions at the network edge before the page even loads — is moving from experimental to practical. This solves the performance paradox of personalization by removing the round-trip to a personalization server from the rendering critical path. Expect this to become the standard architecture for high-traffic sites within two years.
The Final Word: What This Is Really About
I started this piece with a client’s spreadsheet. I’ll end with what that spreadsheet was actually telling me, which took me longer to understand than I’d like to admit.
A 67% increase in revenue per visitor, achieved without changing the product or the traffic or the prices, is not a marketing story. It’s an information story. That outdoor-gear retailer didn’t change what they sold. They changed what they knew about who was visiting and acted on that knowledge coherently across every surface that visitor touched. The website stopped pretending that all visitors were the same. And visitors responded to being treated as individuals rather than as undifferentiated traffic.
That’s the real frame for dynamic website optimization. It is not a conversion rate optimization tactic. It is the systematic application of basic human respect — recognizing that the person on the other side of the browser has context, history, intent, and needs that are specific to them — at the scale and speed of software.
The companies getting this right are not doing anything magical. They are doing something patient, disciplined, and consistently underestimated: building the data infrastructure, sequencing the capability layers, measuring honestly, and treating personalization as a permanent capability rather than a quarterly campaign.
Everything else is just brochures.
McKinsey — Next in Personalization Report · WPO Stats — Web Performance Case Studies · Instapage — 70 Personalization Statistics · Smart Insights — E-commerce Conversion Benchmarks · Genesys Growth — Landing Page Conversion Stats 2026
Explore our deep-dive guides: AI Personalization Hub · Dynamic Content Frameworks · First-Party Data Strategy · Personalization ROI Calculator
https://www.aipersonalization.cloud/blog/