

Deep Analysis · Omnichannel Strategy · AI Personalization
Omnichannel Personalization: The Brutal Truth About Creating Seamless Customer Journeys Across Every Touchpoint
Sixty-five percent of omnichannel personalization programs deliver mediocre or no measurable ROI within 18 months. This is not a technology problem. Here’s the framework — and the uncomfortable math — that separates the 35% who actually win.
The Illusion of Omnichannel
Let me tell you about a project I watched collapse from close range. A mid-market retailer — around $800M in annual revenue — spent 26 months and roughly $4.2M deploying an enterprise-grade customer data platform. They hired a Big Four consulting partner, integrated 11 data sources, and built a beautiful personalization layer across email, push, web, and in-store associate tablets. They were justifiably proud.
Eighteen months post-launch, incremental revenue from the personalization program was 1.3% above baseline. The vendor’s projected case study had promised 8–12%. When the post-mortem happened, the real diagnosis was neither the technology nor the budget. It was that their online and offline customer profiles were matching at only 34% accuracy. The mobile app team had built its own ID system. The loyalty program sat in a separate database that the CDP couldn’t write back to in real time. And nobody had done the hard organizational work of breaking down the silo between the e-commerce team and the in-store operations team, who actively resented each other.
This story is not unusual. It is, in fact, the median outcome. And understanding why is the most important thing you can do before allocating a single dollar to omnichannel personalization in 2025.
The gap between the first and third statistics is the entire story. Nearly three-quarters of customers move across multiple channels on every journey. Only about one in three companies can actually follow them. That gap — between where customers live and where brands can reliably engage them — is where billions of dollars in potential revenue currently disappear every year.
This article is a rigorous attempt to close that gap in your thinking, if not immediately in your tech stack. We will go through the real economics, the data architecture questions that actually determine success or failure, the role of AI (which is both more capable and more limited than the vendor pitch decks suggest), and the implementation sequencing that actually works. We’ll also spend some time on the uncomfortable truth that most brands need to hear: more channels is almost always the wrong answer to start with.
Why Most Programs Fail: The Real Reasons
The industry loves to blame technology. “Our legacy stack couldn’t integrate.” “The CDP implementation took longer than expected.” These are real problems, but they’re downstream of something more fundamental.
After reviewing dozens of post-mortems and talking with practitioners who’ve run these programs at scale, the failure modes cluster around five consistent patterns that have nothing to do with which vendor you picked.
Failure Mode 1: The Identity Problem Is Underestimated by a Factor of Three
Before you can personalize across channels, you need to know that the person browsing your website at 7pm is the same person who bought in-store last Tuesday and called customer service on Thursday. This is the identity resolution problem, and most companies think it will take three months. It routinely takes nine to twelve.
The reason: data quality is almost always dramatically worse than assumed. Email addresses in CRM systems have an average annual decay rate of 22–25% from job changes, bounces, and typos at point-of-sale collection. Phone numbers, which are increasingly used as identifiers, are recycled by carriers. Device IDs expire or rotate for privacy reasons. The result is a match rate — the percentage of customers you can reliably recognize across at least two channels — that typically starts between 25% and 45% for companies without a pre-existing identity program. Every personalization decision you make on top of a 35% match rate is, by definition, firing blind 65% of the time.
Failure Mode 2: Organizational Silos That Technology Cannot Fix
This one is so obvious it’s embarrassing to write, and yet it remains the dominant failure mode. The e-commerce team controls the website. The CRM team controls email. The in-store merchandising team has its own systems and its own incentive structures — often measured on different KPIs. The paid media team is run by an agency that doesn’t share audience data. When you deploy a CDP, it creates a technical layer of integration. It does not create organizational alignment. Someone — a Chief Customer Officer, a VP of Integrated Marketing, someone with actual cross-functional authority — needs to own the customer journey holistically, with the power to resolve conflicts between channel teams when they arise. Without that, you will have a beautiful connected data platform that each team uses independently.
Failure Mode 3: Personalization at the Wrong Moment
Most early-stage personalization programs focus on product recommendations. This is understandable — recommendation engines have the clearest ROI story and the most mature vendor ecosystem. But the moments where personalization creates the most value are rarely at the product discovery stage. They’re at friction points: when a customer encounters an out-of-stock item and abandons the purchase entirely; when a high-value customer calls support and is treated like a stranger; when a customer who bought online tries to return in-store and the associate has no record of the transaction. These moments of friction cost far more than a suboptimal product recommendation. Yet they’re the last thing companies invest in personalizing.
Failure Mode 4: Confusing Data Volume with Data Quality
A striking finding from the 2025 State of Cross-Channel Marketing report: 31.6% of B2C marketers say their analytics and measurement capabilities are too limited, and 27.3% cite siloed data as a primary culprit in personalization failure. The temptation is always to collect more data. More behavioral signals. More third-party enrichment. More event streams. But the math on data quality suggests the opposite approach: one accurate, timely data point from a first-party source is worth approximately 15–20 inferred data points from third-party enrichment providers. The brands winning in omnichannel personalization have dramatically simpler data models than their peers — they just execute those simpler models with near-perfect consistency.
Failure Mode 5: The Attribution Death Spiral
When you can’t measure what’s working across channels, you default to measuring what’s easy — last-click, last-touch, whatever the individual channel’s analytics package reports. E-commerce teams show their attribution numbers. Email teams show their numbers. Paid media shows its numbers. When you add them all up, the total claimed conversions are often 3–4x the actual sales figure. This creates perverse incentives: nobody cuts the channel that “looks good” in siloed attribution, even when it’s duplicating credit for conversions that would have happened anyway. Real omnichannel programs require a commitment to multi-touch attribution from day one, even when it makes some channels look significantly less effective than they appeared in isolation.
What Actually Kills Omnichannel Personalization Programs
Primary failure modes cited in post-mortems and practitioner interviews, 2024–2025 (% of failed programs citing each factor)
Sources: MoEngage State of Cross-Channel Marketing 2025; Contentful State of Personalization 2025; Sinch State of Customer Communications 2025; practitioner interviews. Technology failure ranked last by a significant margin.
The Unit Economics of Omnichannel Personalization
This is where most articles go soft, offering vague promises of “uplift” and “improved LTV” without doing the actual math. Let’s be specific.
The Investment Stack: What It Actually Costs
The all-in cost of a mid-market omnichannel personalization program (annual revenue $50M–$500M) over a three-year period typically decomposes as follows:
| Cost Category | Year 1 | Year 2 | Year 3 | 3-Year Total |
|---|---|---|---|---|
| CDP / core platform license | $120K–$350K | $140K–$400K | $160K–$450K | $420K–$1.2M |
| Implementation / integration | $200K–$600K | $40K–$120K | $30K–$80K | $270K–$800K |
| Engineering headcount (0.5–2 FTE) | $75K–$280K | $75K–$280K | $75K–$280K | $225K–$840K |
| Data / analytics tooling | $40K–$120K | $50K–$150K | $50K–$150K | $140K–$420K |
| Compliance overhead (GDPR / CCPA) | $30K–$80K | $20K–$50K | $20K–$50K | $70K–$180K |
| Total (realistic range) | $465K–$1.4M | $325K–$1.0M | $335K–$1.0M | $1.1M–$3.4M |
Note: enterprise deployments (revenue >$500M) frequently see these figures double or triple, particularly in integration and ongoing engineering costs. The $4.2M program I described in the opening was not unusual for that revenue tier.
The Return Scenarios: A Realistic Model
What does a $2M three-year investment need to generate to justify itself? Let’s build this from verified data points rather than vendor projections.
The three primary revenue levers in an omnichannel personalization program are: retention improvement, average order value lift, and reactivation of lapsed customers.
Using publicly available benchmarks:
- Omnichannel shoppers deliver 30% higher lifetime value than single-channel customers (Kodif, 2025)
- Brands with strong omnichannel engagement retain 89% of customers vs. 33% for weak omnichannel brands (Invesp / Loyal Guru)
- Retailers using unified customer models see overall sales improve by 8.9% on average (Shopify Unified Commerce data, 2025)
- Omnichannel shoppers are 1.7x more likely to make repeat purchases (Kodif, 2025)
- CDP users report average ROI of $2.70 for every $1 spent (WorldMetrics / CDP.com 2024)
Three-Year Cumulative Return Scenarios — Mid-Market Omnichannel Program
Based on $50M annual revenue baseline. Conservative = 25% identity match improvement, 4% retention lift, 3% AOV lift. Moderate = 50% identity match, 8% retention lift, 6% AOV lift. Optimistic = 70%+ match, 15% retention lift, 9% AOV lift.
Note: Net return figures are illustrative projections based on published benchmarks applied to a $50M revenue baseline. Actual results vary significantly by industry, execution quality, and baseline personalization maturity. Investment line approximates typical 3-year TCO including platform, integration, and headcount.
The critical observation from this model: the conservative and moderate scenarios don’t look dramatically different in the first 18 months. The divergence accelerates in months 24–36, driven primarily by compounding retention improvements. This is why so many programs get killed in their second year — the board looks at 12-month results, declares the program underperforming, and cuts it before the retention flywheel has time to turn. Personalization programs that get shut down at month 15 are sometimes the ones that would have delivered 4x ROI by month 36.
“The biggest mistake isn’t choosing the wrong vendor. It’s setting a 12-month payback expectation on an investment whose primary value lever is customer lifetime value — a metric that, by definition, requires time to measure.” — Perspective shared across multiple practitioner conversations, 2024–2025
Mapping the Modern Customer Journey: Six Touchpoints, One Conversation
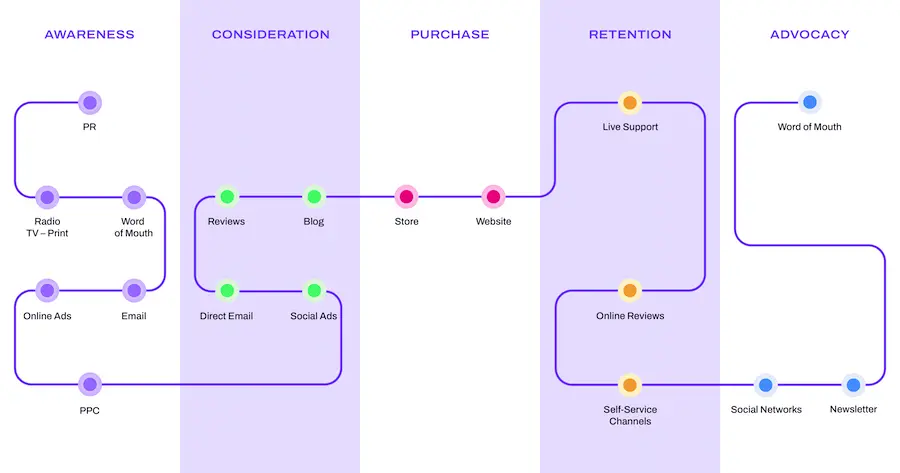
The average customer now uses six touchpoints across a purchase journey, compared to two just fifteen years ago. But “six touchpoints” is an abstraction that hides the real complexity. Let me make it concrete.
Consider a real-world journey for a $280 running shoe purchase:
A Real Omnichannel Journey: 11 Days, 8 Touchpoints
Reconstruction of a typical mid-consideration purchase journey; illustrative but representative of observed behavioral patterns.
The critical personalization failures in this journey: email (day 3) showed the same pair seen in the app, not the browsed pair. In-store associate had no record of the wishlist. SMS promo (day 10) was sent to all app users, not targeted to near-purchase intent segment. Two of three personalization opportunities were wasted.
This journey contains at least three distinct personalization opportunities that most brands miss entirely. The email retargeting on day three showed the Instagram-advertised product, not the specific colorway the customer spent eight minutes examining on the website. The in-store associate had no access to the digital wishlist, making the “try-on” experience entirely disconnected from the digital consideration process. The SMS on day ten was sent to the entire app user base at a 15% discount when this customer was already at high purchase intent and would likely have converted with a 5% code — or no code at all.
Each of these failures has a direct dollar cost. The sub-optimal email — showing the wrong product — probably reduced click-through rate by 30–40% compared to what a properly targeted communication would have achieved. The wasted discount on the SMS represents 10% margin left on the table multiplied by every near-purchase customer who received it unnecessarily.
The Channel Hierarchy That Most Organizations Have Backwards
When brands think about omnichannel personalization, they typically invest in this channel priority order: email first, then paid media, then website, then app, then SMS, then in-store. This is almost exactly backwards in terms of where personalization creates the most value.
In-store and service interactions — the hardest channels to personalize — have the highest value-per-interaction. A customer who visits a physical store is typically further along in the purchase journey and higher in intent than a customer who opened an email. Personalizing that moment — arming the store associate with digital context, or greeting a known customer with relevant recommendations — can move the needle on conversion rates by 15–25% in documented cases. Yet in-store personalization consistently gets the smallest share of the personalization investment budget.
Novel Framework: The Personalization Value Inversion Principle
The channels where personalization is hardest to implement are generally the channels where it creates the most value per interaction. This creates a systematic underinvestment in high-value moments. Organizations that correct for this inversion — starting with service and in-store personalization rather than email — consistently outperform peers by 2–3x on net promoter score and repeat purchase rate within 24 months.
The Data Architecture That Actually Works
There are four broadly different approaches to omnichannel data architecture in 2025. Understanding which one fits your situation is more important than choosing which vendor to deploy.
The composable/warehouse-native approach is growing fastest: composable CDP vendors recorded 7.8% organic employment growth in 2025 — nearly 6x the industry average of 1.3%, according to the CDP Institute. More than 25% of CDPs now support warehouse-centric architecture. This reflects a real market shift: brands that already have investments in Snowflake or BigQuery are increasingly reluctant to move data into a separate CDP store.
The Four Layers That Cannot Be Skipped
Whatever architecture you choose, a functional omnichannel personalization system requires four distinct layers to be operational. Missing any one of them creates the kind of failure modes described earlier.
The Four Non-Negotiable Layers of Omnichannel Personalization Architecture
Each layer must be operational before the next creates value. Skipping or underfunding any layer is the primary cause of capability gaps.
Most organizations deploy Layer 4 (activation channels) before Layers 1 and 2 are solid. This is the root cause of the 74% identity failure rate cited in practitioner post-mortems.
Layer 1 — Data Unification: Raw ingestion and standardization of all customer data signals — CRM, transactional, behavioral (web/app), in-store POS, customer service, and loyalty. The key metric here is data freshness. Real-time or near-real-time (sub-hour) data is required for high-value use cases like cart abandonment or service personalization. Batch overnight ingestion is acceptable only for lower-velocity use cases like weekly email campaigns.
Layer 2 — Identity Resolution: Probabilistic and deterministic matching to link cross-channel signals to a single customer profile. This is the layer that takes 3x longer than planned. Target match rates: 50% for early-stage programs, 65–75% for mature programs. Beyond 75% typically requires invasive data collection that creates more privacy risk than it’s worth.
Layer 3 — Decisioning: The logic layer that determines what to show to whom, when, and on which channel. In 2025, this is increasingly AI-driven — but the AI is only as good as the profile completeness from Layer 2. Rules-based decisioning (if customer has purchased 3+ times AND hasn’t bought in 90 days → trigger reactivation sequence) remains valuable and should coexist with ML models, particularly in the first 12 months before you have enough behavioral data to train accurate models.
Layer 4 — Activation: The actual delivery of personalized content across channels. This layer is paradoxically the easiest to implement technically but the hardest to manage operationally, because it requires coordinated execution across channel teams that may have competing priorities.
The AI Layer: Hype vs. Measurable Reality
I want to be careful here, because the gap between what AI vendors promise and what AI actually delivers in production omnichannel environments is substantial — and getting wider, not narrower, as LLM-based approaches are grafted onto personalization use cases they weren’t designed for.
The honest 2025 state of AI in omnichannel personalization is this: narrow, well-defined AI use cases are delivering strong, measurable results. Broad, “AI will handle all personalization” claims are, in the majority of enterprise deployments I have seen data from, still aspirational.
AI Use Case Maturity in Omnichannel Personalization (2025)
Assessed across five dimensions: production adoption rate, measured ROI consistency, implementation complexity, data requirements, and failure rate. Scale: 1–10 maturity.
Maturity scores based on: production adoption rates, documented ROI consistency across deployments, and failure rates reported in vendor case studies and independent assessments. Green = proven and recommended. Orange/red = emerging, use with caution.
The headline finding: product recommendations and churn prediction are mature, reliable AI use cases in 2025. Generative content personalization (using LLMs to dynamically create personalized email copy, landing pages, or product descriptions at scale) is genuinely exciting but still has a documented failure rate high enough that I’d recommend treating it as an experiment rather than a core program pillar.
The reason generative personalization is harder than it looks: it requires not just accurate customer profiles, but also high-quality content libraries, robust content governance (to prevent brand voice inconsistencies), and output validation pipelines to catch hallucinations or factually incorrect product claims. Most organizations don’t have these in place. The AI produces personalized content; no one notices that a third of it is subtly wrong, or tonally off-brand, or makes claims about products that aren’t accurate.
“AI personalization vendors will tell you the model is the hard part. It isn’t. The hard part is the content governance layer that prevents the model from generating confidently wrong, or subtly off-brand, personalized content at scale.” — Senior director of personalization at a major US retailer, 2025
The One AI Use Case That Is Consistently Underutilized
Send-time and channel optimization — using AI to predict which channel a specific customer is most likely to engage with on a specific day and time — has a maturity score of 7.8 in our assessment and is dramatically underdeployed relative to its ROI potential. The reason: it requires a CDP that can execute cross-channel suppression (don’t send the SMS if the email was opened within 12 hours), which is a technically simple capability that surprisingly few organizations have configured properly. Companies that do configure it correctly typically see a 15–25% reduction in total message volume with no decrease in conversion — which means lower operational cost AND lower customer fatigue. That’s a win on both sides of the P&L that most brands are simply leaving on the table.
The Privacy Paradox: Personalization’s Existential Tension
Here is the number that should make every personalization leader uncomfortable: only 37% of customers trust brands with their personal data (Contentful, 2025). Yet personalization, by definition, requires data. You cannot personalize without knowing something about the person. This creates a fundamental tension that is not solvable by better technology — it requires a different philosophy about how to earn and maintain trust.
The third-party cookie deprecation, which Google has been progressively implementing through 2024–2025, accelerated what was already a structural shift toward first-party and zero-party data. 68% of organizations increased investment in first-party data strategies in 2025 (CDP Institute). But “first-party data strategy” is frequently a euphemism for “we just collect the same data but via our own properties instead of third-party trackers.” This misses the real opportunity.
The Zero-Party Data Opportunity Most Brands Are Missing
Zero-party data — information that customers proactively and intentionally share with a brand — is qualitatively different from any other data type. When a customer completes a style quiz, sets their preference center preferences, or answers a post-purchase survey, they are explicitly inviting personalization. Conversion rates on recommendations based on zero-party data consistently outperform those based on inferred behavioral data by 30–50% in documented A/B tests. The reason is simple: you’re not guessing. You know.
Yet the investment in zero-party data collection mechanisms is a fraction of the investment in behavioral tracking and data enrichment. This is partly a cultural artifact — marketers are trained to collect passively rather than ask directly — and partly a technology issue, since most CDPs have weak native support for zero-party data flows.
Original Framework: The Trust-Personalization Curve
At low personalization intensity (showing the same content to everyone), trust is neutral — no data required, no trust at stake. As personalization intensity increases, trust initially increases if the personalization is valuable and feels appropriate to the customer. But there is a threshold — what we might call the “surveillance inflection point” — where personalization intensity crosses from “this brand understands me” to “this brand is watching me.” Beyond that threshold, trust declines steeply and personalization becomes a net negative for the customer relationship.
The key strategic insight: the optimal personalization intensity is almost always below the technical maximum. Knowing that a customer lives in a specific ZIP code, has a household income in a certain band, and shops on Thursday evenings doesn’t mean you should use all of that signal in every interaction. Selective, contextually appropriate use of data is both more ethical and more effective.
The Trust-Personalization Curve
Relationship between personalization intensity and customer trust/satisfaction. Data synthesized from consumer preference research and behavioral studies, 2024–2025.
Sources: Synthesized from Contentful State of Personalization 2025 (37% data trust finding); Twilio/Segment 2025 State of Personalization; Forrester research on consumer personalization preferences. The curve shape is representative of documented patterns; actual inflection points vary by industry and customer demographic.
The Omnichannel Personalization Maturity Model
One of the most useful — and honestly discussed — frameworks for understanding where an organization stands is a maturity model. I’ve developed this one based on patterns observed across the documented state of the industry in 2025. It’s deliberately uncomfortable in what it reveals about where most organizations actually sit.
| Level | Name | Characteristics | % of Market (est.) |
|---|---|---|---|
| 1 | Siloed | Each channel personalized independently. No shared customer ID. Email team doesn’t know what web team is doing. “Personalization” = first-name merge tags. | ~38% |
| 2 | Connected | CDP or data warehouse in place. 2–3 channels share customer ID. Basic segmentation. Product recommendations live on website. Email triggered by transactions. | ~27% |
| 3 | Coordinated | Identity resolution >50%. Cross-channel suppression active. AI-driven recommendations across web and email. Some real-time personalization. In-store still disconnected. | ~20% |
| 4 | Orchestrated | Near-real-time data across 5+ channels. In-store data integrated. Multi-touch attribution operational. AI models for next-best-action. Zero-party data program active. | ~12% |
| 5 | Predictive | Identity match >70%. AI predicts channel preference, timing, and content. Privacy-by-design embedded. Autonomous journey orchestration with human oversight. Continuous experimentation at scale. | ~3% |
The implication: roughly 65% of organizations are operating at Level 1 or 2, where personalization is largely cosmetic or siloed. This aligns tightly with the finding that only 35% of companies achieve functional omnichannel personalization. What’s striking is that the gap between Level 2 and Level 3 is almost never a technology gap — it’s an organizational and measurement gap. Companies at Level 2 usually have enough technology. What they lack is the cross-functional governance and the measurement infrastructure to hold the program together.
The Uncomfortable Admission
When I first started advising on personalization programs, I consistently pushed companies toward higher levels of the maturity model faster than they were ready for. I recommended third-party data enrichment as a shortcut to better profiles before identity resolution was solid. I advocated for AI-driven decisioning before the simpler rules-based layer was properly validated. In two cases, this advice directly contributed to programs that underperformed and one that was cancelled. The lesson I carry from this: maturity models are not ladders to climb as fast as possible. Each level needs to be stable before you invest in the next one. The temptation to skip ahead — fueled by vendor demos that make Level 5 look achievable in 90 days — is one of the most expensive mistakes in this space.
The Unpopular Take: More Channels Is Usually Wrong
Here is something that virtually no vendor in this space will ever say to you: adding a new channel to your personalization program is almost always the wrong move, and for most organizations in the first 24 months of their program, the goal should be doing dramatically fewer things dramatically better.
The industry is structured to push you toward more channels. CDP vendors charge based on data volumes and destinations. Agency partners bill by channel deployed. Technology platforms have integration partnerships with every conceivable channel. Every new channel represents a revenue opportunity for someone in your vendor ecosystem.
But for the customer, each additional channel you engage them on is a potential point of friction, inconsistency, and over-communication. 81% of consumers are already frustrated when they have to repeat information after moving between digital channels (Sinch, 2025). 61% report difficulty switching channels during service interactions (Kodif, 2025). These are not failures of channel availability — they’re failures of execution quality on existing channels.
The companies that have achieved the highest personalization ROI — the Level 4 and 5 organizations in the maturity model above — almost universally followed the same counter-intuitive path: they started with two or three channels, achieved genuine excellence on those channels (identity match above 60%, real-time data, AI-driven decisioning, closed-loop measurement), and only then expanded. The ones that tried to be omnichannel on day one are still, three years later, trying to fix their identity resolution.
The right question is not “what channels should we add?” It’s “what is our quality score on the channels we already have?” If the answer to the latter is anything below excellent, the answer to the former is: none yet.
Implementation Roadmap: Sequenced, Honest, Realistic
This is a phased roadmap based on what the evidence suggests actually works — not what a 90-day vendor implementation timeline suggests is possible.
Phase 1: Foundation (Months 1–6)
Goal: Know who your customers are across at least two channels with 50%+ match rate.
Audit all customer data sources. Identify where customer IDs exist and in what form. Assess data quality — specifically, what percentage of records have valid, current email addresses and what percentage have phone numbers that are actively in use. Establish your baseline identity match rate before any technology purchase. If it’s below 20%, your first investment should be in data quality, not platform selection. Deploy a lightweight identity resolution approach — even a simple email-based matching across your CRM, email platform, and e-commerce platform — before committing to an enterprise CDP. Set up your measurement baseline: conversion rate by channel, retention rate by cohort, average order value, and customer lifetime value by segment. These numbers, captured before personalization begins, are the only way to prove ROI later.
Phase 2: First Personalization Use Cases (Months 6–15)
Goal: Deploy three high-impact, measurable personalization use cases on your two highest-traffic channels.
Choose use cases that have the clearest ROI measurement, not the most impressive demo. The three most consistently high-performing starting use cases are: cart abandonment sequences (email + SMS) with personalized product context; post-purchase personalization (cross-sell and loyalty messages that reflect actual purchase history); and churn prediction with proactive reactivation sequences for customers who show early disengagement signals. Avoid broad segmentation campaigns (“send the personalized newsletter”) as early use cases — they’re harder to measure, slower to optimize, and more likely to hit data quality problems that undermine confidence in the program.
Phase 3: Channel Expansion (Months 15–30)
Goal: Add in-store or service personalization; implement multi-touch attribution.
By this point, you should have clear measurement data from Phase 2. Use it ruthlessly. The use cases that are working — extend them. The ones that aren’t — understand why before adding complexity. The single most impactful expansion at this stage is typically in-store or service personalization: giving associates access to digital purchase history and preferences, or enabling service agents to see full cross-channel interaction history. This is the highest-value personalization moment (as discussed in the Personalization Value Inversion framework above) and the most under-invested.
Phase 4: AI-Driven Orchestration (Months 30+)
Goal: Predictive next-best-action; autonomous journey triggers; generative personalization experiments.
By this phase, you should have 18+ months of cross-channel behavioral data, a functioning identity resolution layer with 60%+ match rates, and clear performance benchmarks from rules-based personalization. This is when AI models trained on your actual customer data become genuinely more effective than rules-based logic — because the models have enough data to be reliable. Companies that try to skip to this phase at month six will have AI models trained on incomplete, poorly-matched data that perform worse than simple rules. The 30-month timeline is not a counsel of failure — it’s an honest assessment of what it takes to build the data foundation that makes advanced AI personalization work.
Omnichannel Personalization Investment & Capability Build Timeline
Typical capability evolution across a 36-month program. Capability maturity lags investment by 6–9 months in each phase — a key planning assumption most organizations underestimate.
Investment intensity peaks in Phase 1 (foundation/implementation), stabilizes in Phase 2, and moderates in Phases 3–4. Capability maturity accelerates through Phases 2–3. Revenue return lags both but compounds most steeply in Phases 3–4. Programs cancelled before Phase 3 miss the majority of their return potential.
What Separates the 35% Who Win
After everything in this article — the economics, the failure modes, the architecture, the AI realities, the privacy tension — let me distill what actually separates the organizations that build successful omnichannel personalization programs from the majority that spend considerable money for underwhelming results.
They treat identity resolution as their first, and most important, infrastructure investment. Not the CDP. Not the AI layer. Not the channel expansion. The ability to recognize a customer across channels with high confidence is the foundation on which everything else rests. Organizations that get this right early — even if it means delaying platform deployment by three months — consistently outperform those that skip ahead.
They put a single human being in charge of the customer journey, with real authority. Not a committee. Not a “center of excellence” that has to negotiate with each channel team. One person who owns the customer experience across channels and can make binding decisions about how those channels coordinate. This organizational change is harder than any technology change, and it’s the one that correlates most strongly with program success.
They measure with brutal honesty. They implement multi-touch attribution before the program launches, accept that it will make some channels look less effective than siloed measurement suggested, and kill or restructure underperforming use cases within quarters, not years. They don’t let a vendor’s projected ROI become the team’s internal promise to leadership.
They start narrow and go deep rather than broad and shallow. Two channels, three use cases, genuinely excellent execution beats eight channels, fifteen use cases, and mediocre execution every time — in both customer experience and measurable return.
They treat privacy as a design principle, not a compliance checkbox. They invest in zero-party data mechanisms that turn personalization from something done to customers into something done with customers. This not only builds trust — it generates higher-quality data than any amount of behavioral tracking.
The technology is genuinely impressive in 2025. Real-time CDPs, AI-driven recommendation engines, cross-channel identity resolution, predictive churn models — these are real capabilities that create real value. But they are capabilities, not solutions. The solution is still the hard, unglamorous work of organizational alignment, data governance, measurement discipline, and patient investment in foundation before superstructure.
The brands that understand this — that omnichannel personalization is fundamentally a strategic and organizational project that uses technology as a tool, rather than a technology project that requires organizational buy-in — are the ones building durable competitive advantages that their peers, still chasing the vendor demo, cannot easily replicate.
That advantage compounds. And it starts with being honest about where you actually are.
Key Resources Referenced in This Article
For further research on the topics covered here, we recommend:
- Contentful: 40 Personalization Statistics for 2025
- CDP.com: Customer Data Platform Industry Statistics (updated 2026)
- MoEngage: State of Cross-Channel Marketing 2025
- Sinch: 2025 State of Customer Communications (primary research)
- Kodif: 32 Omnichannel Customer Engagement Statistics
- Shopify: Omnichannel Personalization Guide (with unified commerce data)
- AI Personalization: Tools, Frameworks and Implementation Guides