
Omnichannel Personalization: What the Evidence Supports, and How to Build It
Quick answer. Omnichannel personalization means recognizing the same customer across channels and letting what happens in one channel change what happens in the next, fast enough to matter. The business case is real but smaller and less proven than the famous statistics suggest. Those numbers trace back to a 2013 vendor-adjacent survey and a 2017 observational study of one retailer. Build in this order: identify customers at the point of sale, connect two channels around one trigger, prove lift with a holdout group, and only then buy heavier technology.
Updated September 30, 2026 · 14-minute read
Where I land
Three positions, so you know what the rest of the article is arguing:
- The omnichannel premium is mostly a customer-quality signal before it is a technology effect. People who use four channels were already your most engaged customers. No study I found separates “omnichannel made them valuable” from “valuable customers use more channels.”
- Identity capture is the real project. A customer you cannot recognize at the store register cannot be personalized anywhere else, no matter what you spend on AI.
- Most mid-market brands should not start by buying a customer data platform (CDP). Start with two channels, one trigger and a holdout. Spend more only when that test shows lift.
I rebuilt this article after tracing every major statistic in the previous version to its source. Several did not survive, and the section on corrections at the end lists them.
What omnichannel personalization actually is
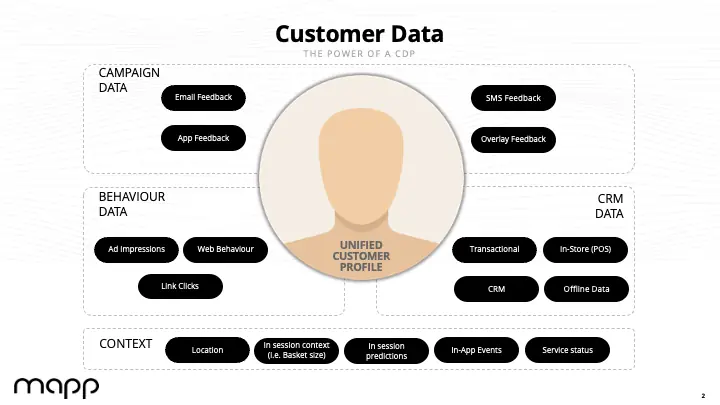
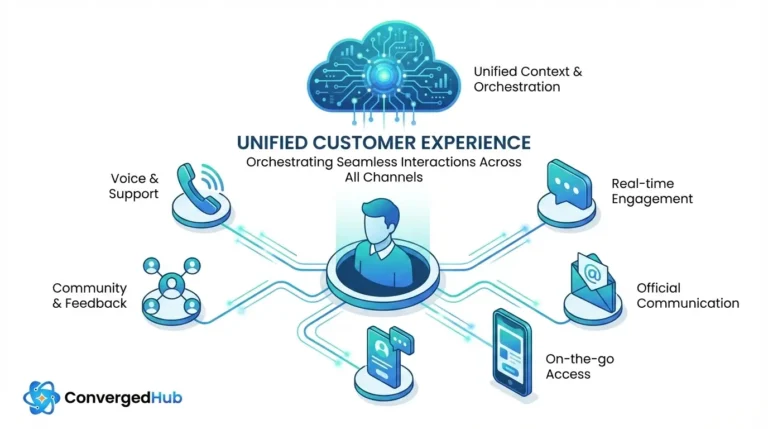
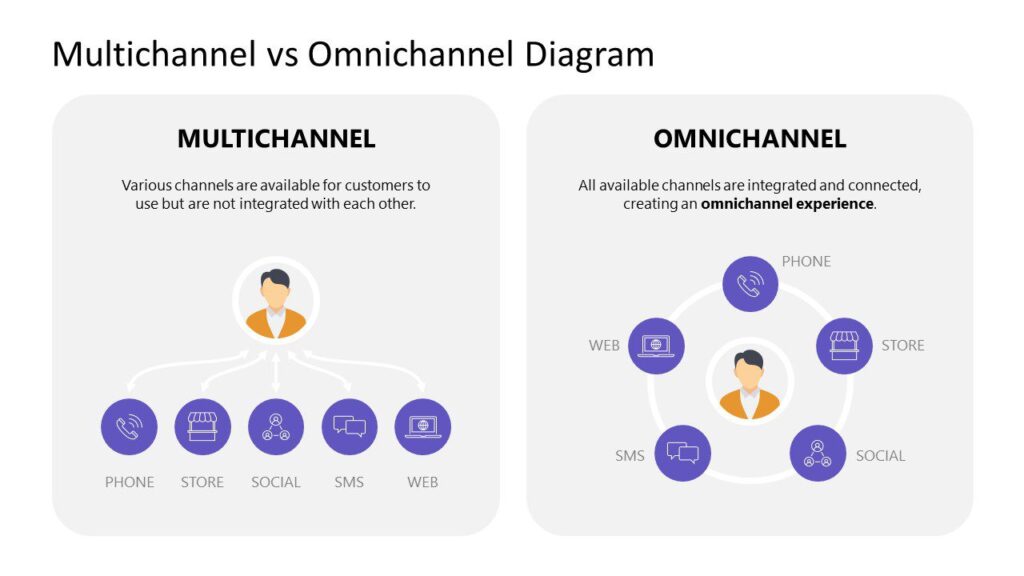
Omnichannel personalization is the delivery of individually tailored experiences across web, app, email, SMS, store and support, driven by a shared customer profile that updates quickly enough to change the next interaction. The word that matters is shared. If each channel keeps its own profile, you have multichannel marketing, whatever the vendor calls it.
A customer who abandons a cart in your app should not get a generic email the next morning. That is the failure omnichannel exists to prevent. If the abandonment event reaches the profile within minutes, the right response might be a push notification now, an email only if the push is ignored, and total silence if they buy in the store that afternoon.
A three-part test you can run this week
I use this to separate real omnichannel from multichannel with good branding. It is my own diagnostic, not an industry standard. Score each pair of channels you care about (for example app ↔ store, or web ↔ email).
| Test | Question | Score 0 | Score 1 | Score 2 |
|---|---|---|---|---|
| Identity | Can you link the same person across the two channels? | Rarely | Only for logged-in or known customers | For most transactions, including store |
| Latency | How fast does an event in channel A change what channel B does? | Next day or slower | Within hours | Within minutes |
| Proof | Can you show the connection produces lift? | No measurement | Before/after comparison | Randomized holdout group |
Reading the total (0–6): 0–2 is multichannel. 3–4 is partially connected. 5–6 is omnichannel you can defend to a CFO. Most programs I see described in vendor material would score 1 or 2 on Proof.
The numbers everyone quotes, traced to their sources
When I traced the retention statistic that anchors most omnichannel articles, it led to a survey of 305 companies run in mid-2013. That is a very different thing from “brands with connected omnichannel retain 89% of customers,” which is how it circulates. I then checked the other headline figures the same way.
How I checked. I opened the original publication or press release wherever it was accessible. Where the original is paywalled (Harvard Business Review, Aberdeen, IDC), I relied on contemporaneous trade coverage and excerpts, and I say so in the table.
| Claim as it circulates | What the source actually says | Strength |
|---|---|---|
| “Connected omnichannel retains 89% of customers vs. 33% for siloed” | Aberdeen Group, Omni-Channel Customer Care, reported December 2013. Survey of 305 companies in May–June 2013. “Top performers” were the top 20% (61 firms), compared with the other 80%. It concerns customer care, is self-reported, and dates from 2013. | Weak. Correlation from a small, old survey. |
| “9.5% vs. 3.4% revenue growth” | Same Aberdeen study, same limits. | Weak. |
| “Omnichannel customers have 30% higher lifetime value” | Widely credited to Harvard Business Review or Google. The Medallia white paper I found attributes it to a 2015 IDC study. I could not open the IDC original. The HBR excerpts I read do not report a 30% figure. | Unverified. Do not cite as HBR. |
| HBR: 46,000 shoppers | Sopadjieva, Dholakia and Benjamin, HBR, January 2017. One large U.S. retailer, June 2015 to August 2016. 73% of shoppers used multiple channels. Compared with single-channel shoppers, they spent about 4% more per in-store occasion and 10% more online, and made 23% more repeat trips within six months. | Moderate. Real data, observational, one retailer. |
| McKinsey: 71% expect personalization, 76% get frustrated, fast growers earn 40% more of revenue from it | McKinsey: The value of getting personalization right—or wrong—is multiplying, 2021. The 40% figure is a share of revenue at faster-growing companies, not proof that personalization caused the growth. A third-party review of personalization statistics notes the page publishes no sample size or fielding window; I could not confirm that beyond the excerpt I read. | Moderate for direction, weak for size. |
| Gartner: 80% of marketers will abandon personalization by 2025 | Gartner press release, December 2, 2019. It is a prediction, not a measurement. I did not find a published check of whether it came true. | Forecast only. |
| CDP market size | Mordor Intelligence, May 15, 2026: USD 4.58 billion in 2026 to USD 13.14 billion by 2031, a 23.47% CAGR. One research vendor’s estimate. | Single estimate. |
What this means
The defensible claim is narrower than the marketing version. The HBR study shows that multichannel shoppers at one retailer spent modestly more and came back more often. It cannot tell you whether connecting channels caused that. The Aberdeen figures compare self-selected strong performers with everyone else. Neither study isolates the effect of the technology.
Key insight. Treat every published uplift figure as an upper bound on what you will see. Your own holdout test is the only number that belongs in your business case. Gartner’s own advice in the 2019 release points the same way: pilot with a vendor and test at the segment level before buying a personalization engine.
Two of these numbers were inconsistent in the previous version of this article. It cited a $37 billion CDP market by 2030 in one place and $13.14 billion by 2031 in another. The Mordor release supports only the second.
What three brands actually show
Case studies in this space usually attach a dramatic lift to a famous name. I looked for primary data instead: earnings materials, investor dashboards and trade reporting. The picture is more useful, and less flattering to vendors, than the usual version.
Starbucks: identity is an asset, not a growth engine
Starbucks publishes a quarterly investor dashboard. For the quarter ended June 28, 2026 (fiscal Q3), it reports 35.8 million 90-day active Starbucks Rewards members in the U.S. and members accounting for 59% of dollar tender in U.S. company-operated stores. Mobile orders made up 33% of transactions.
| Quarter | 90-day active U.S. members | Member share of tender |
|---|---|---|
| Q3 FY24 | 33.8M | 60% |
| Q3 FY25 | 33.9M | 58% |
| Q3 FY26 | 35.8M | 59% |
Source: Starbucks Digital IR Dashboards. Growth from Q3 FY24 to Q3 FY26 is 5.9% (35.8 ÷ 33.8), which is my calculation.
Reading it. Roughly 60% of tender flows through identified members, which is the payoff of capturing identity at scale. But member counts moved by single digits in two years, and the share of tender has stayed between 58% and 60% for nine consecutive quarters. What Starbucks changed in March 2026 was the reward design: new Green, Gold and Reserve tiers, and a 60-Star, $2-off reward that accounted for about a third of redemptions on the second-quarter call. Trade reporting describes the previous program as overly reliant on discounts. So the recent lift came from offer discipline on top of an identity base, not from the base alone.
What you can copy: treat identity capture as the foundation and tune the offer separately. What you cannot copy: a payment app that 35 million people open weekly.
Sephora: the identifier is the product
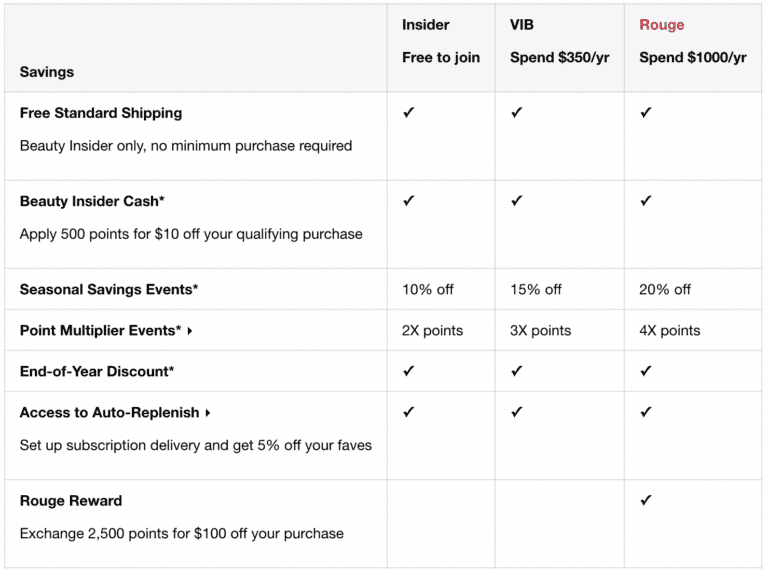
Sephora’s loyalty program, Beauty Insider, launched in 2007. Membership is reported at roughly 45 million in North America (Sephora newsroom, January 2026, as cited by a secondary source) and more than 46 million by Glossy’s count; the two figures may differ in scope. Sephora says members account for a majority of its sales, and reporting from 2024 put fewer than 10% of members in the top tier.
The identity mechanism worth studying is older. The Sephora + Pantone Color IQ device debuted in July 2012 and scans a shopper’s skin into 27 images in under two seconds, then assigns an official Pantone skin-tone number. In 2015, Sephora extended the same number to lip and concealer matching and let customers email their results to themselves. A free in-store service produces a durable customer identifier and a reason to return.
What I could not verify: any published sales lift from the skin-tone number or from linking it across the app and email. The previous version of this article stated specific percentage lifts. I found no primary source and removed them.
Nike: owning every channel is not the same as omnichannel
Nike built one of the most data-rich direct relationships in apparel. Digital Commerce 360, tracking Nike’s reports, counted the seventh consecutive quarter of Nike Digital sales declining more than 10% in fiscal Q2 2026 (quarter ended November 30, 2025). Digital fell 14% that quarter, Nike Direct fell 8%, and wholesale rose 8%. Management’s stated response is to cut promotions, clean up the marketplace, and reposition Nike Digital as a full-price channel inside what it calls an integrated marketplace of digital, physical, and wholesale. On the September 2025 earnings call, the CEO said Nike Digital was “still working to find solid ground.”
Reading it. I am not claiming personalization failed at Nike. Management points to discounting and channel mix, and I have no evidence linking the decline to personalization. The point is narrower: rich first-party data did not protect a channel from a weak product and promotion strategy. Personalization amplifies a sound commercial position and cannot repair a broken one. Later quarters may differ; fiscal Q2 2026 is the latest I verified. The previous version’s claims about Run Club data shaping in-store recommendations and about specific store formats could not be sourced, so I removed them.
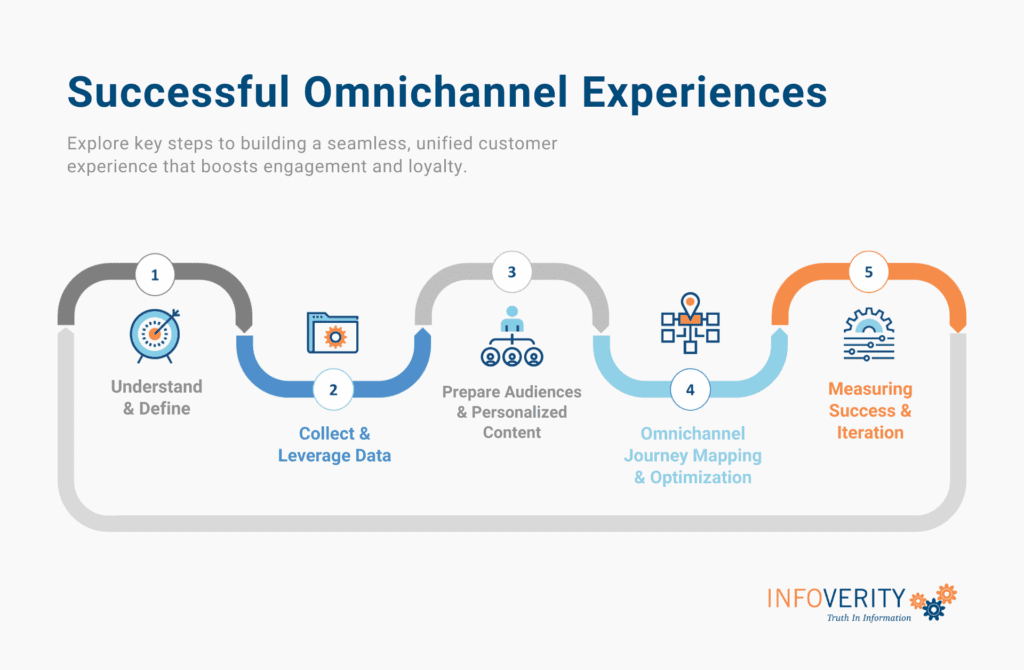
The build order
This is the practical core. It is my recommended sequence, informed by the evidence above. It is not an industry standard.
Stage 0: measure your identified-transaction rate
Define identified-transaction rate (ITR) as the share of transactions in a channel that carry a persistent customer identifier such as an email or loyalty ID. Measure it separately for web, app, and store.
My rule of thumb, which is a judgment and not a benchmark: do not buy orchestration software until a majority of transactions in your two largest channels are identified. Below that, the software will personalize a minority of your customers and report on a biased sample. Fix capture first: an email prompt at the register, a loyalty sign-up worth completing, a guest-checkout flow that offers account creation after purchase. For the profile itself, see why unified customer profiles decay without maintenance.
Stage 1: one trigger, two channels, one holdout
Pick one high-intent event, for example, a browse or cart abandonment. Connect two channels around it: app or web signal in, email or SMS out, with suppression after conversion. Randomly hold out about 10% of eligible customers from the trigger for at least one full purchase cycle. That group is your evidence.
- Metric: incremental revenue per eligible customer, holdout versus treated, not opens or clicks.
- Tool: the A/B test significance calculator tells you whether the difference is distinguishable from noise.
Stage 2: connect the store or service handoff
Give store associates or support agents a view of recent online activity. This is where identity capture from Stage 0 pays off, and it is cheap compared with real-time orchestration.
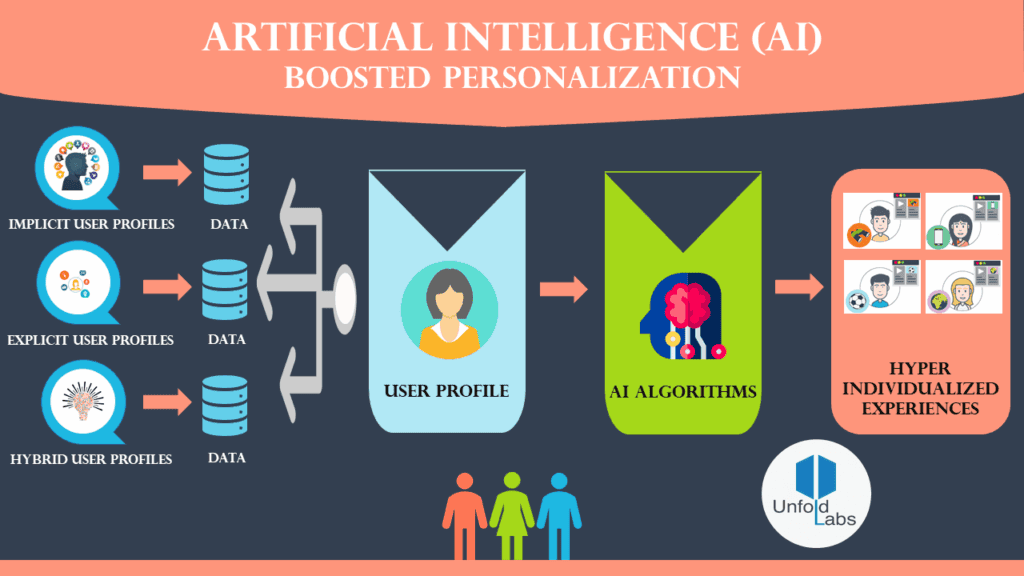
Stage 3: predictive models and AI decisioning
Only after Stage 1 shows lift. Then require the model to beat a simple rule (for example, recency and frequency thresholds) in a head-to-head holdout. If it cannot, you have bought complexity. For background on the modeling side, see predictive behavioral segmentation and AI behavioral analytics.
Kill criteria
Stop expanding if, after two purchase cycles, the confidence interval on your holdout difference includes zero. That is not failure; it is information that saved you a platform contract.
A worked break-even example
The numbers below are illustrative assumptions, not data. Substitute your own or use the personalization ROI calculator.
| Input | Value |
|---|---|
| Annual cost (platform, integration, staff time) | $250,000 |
| Annual revenue from identified customers | $20,000,000 |
| Gross margin | 40% |
| Margin pool | $8,000,000 |
| Break-even lift on that pool | 3.1% ($250,000 ÷ $8,000,000) |
Now stress the assumption. The HBR study found associations of roughly 4% to 10% higher spend. If only a third of that is causal, which is a deliberately cautious assumption of mine, the realistic lift is about 1.3% to 3.3%. That range straddles the break-even point. A brand with $20 million of identified revenue is at best marginal for a $250,000 program. It becomes attractive at higher revenue, at lower cost, or after a holdout test shows a larger effect than the published studies suggest. That is the reason for the staged approach above.
Measurement: prove it or do not claim it
Channel metrics (open rate, push click-through, store conversion) tell you how each channel performs. They do not tell you whether the connection between channels pays.
| Metric | What it tells you | Watch out for |
|---|---|---|
| Identified-transaction rate | How much of your business the system can even see | Inflated by duplicate profiles |
| Incremental revenue per eligible customer | Causal lift, holdout versus treated | Needs a full purchase cycle |
| Cross-channel repeat rate | Whether connected customers return more | Selection bias: engaged customers self-select |
| Time from event to action | Whether latency is what you think it is | Batch syncs hide delays |
| Suppression accuracy | Whether converted customers still get promotions | A quiet trust and cost leak |
Set attribution rules before launch. Email, paid and store teams will all claim the same conversion. The fix is organizational: agree in advance that holdout results settle disputes.
Privacy, consent and the cookie reality
Two facts from the previous version needed correcting.
Third-party cookies did not disappear. Safari, Firefox and Brave block them by default, but Chrome, which carries most desktop and Android traffic, kept them. Google announced on April 22, 2025 that it would maintain its current approach to third-party cookie choice and would not roll out a new consent prompt, and it retired most Privacy Sandbox technologies in October 2025. Your audience is still fragmented by browser, so first-party data is the sturdier bet, but the reason is trust and control, not that cookies vanished.
Trust is the constraint. Twilio’s 2022 State of Personalization report found only 40% of consumers trust brands to use their data responsibly, while 63% accept personalization when it relies on data they gave the brand directly. That is a vintage-2022 finding, and I did not verify a more recent equivalent. The design implication holds anyway: personalize from what customers knowingly gave you, and let them see and change it. Build consent management into the architecture, and check your setup with the data privacy compliance checker. For the wider approach, see privacy-first personalization.
Where programs actually fail
- No identity at the point of sale. Covered in Stage 0. It is the most common structural hole.
- No owner above the channels. Give one person authority over suppression rules and send volume across channels. Without that authority, each channel team maximizes its own numbers and the customer receives all of it.
- Attribution fights. Settle them with holdout tests, as above.
- Data quality after unification. Mordor’s own list of market restraints includes fragmented legacy schemas and a shortage of reverse-ETL talent for composable CDP rollouts. In plain terms: unifying bad data produces confident bad decisions. Audit duplicates and stale records before adding sources.
What I could not verify
- Paywalled originals. I read the HBR study through excerpts and reproductions, and the Aberdeen and IDC studies through trade coverage and a vendor white paper.
- McKinsey’s methodology. I read the published excerpt and did not confirm sample size or fielding dates.
- Personalization mechanics at named brands. I found no primary data tying a specific Starbucks, Sephora or Nike personalization feature to a specific revenue figure.
- AI-specific lift claims. I did not evaluate vendor claims about AI-driven orchestration in this update, so treat them as first-party claims until tested.
- Gartner’s 2025 outcome and Nike after fiscal Q2 2026. Not verified.
Frequently asked questions
What is the difference between multichannel and omnichannel personalization?
Multichannel means you are present on several channels. Omnichannel means those channels share customer context quickly enough that one channel’s events change another’s behavior. The three-part test above gives you a way to score it.
Do I need a customer data platform to do this?
Not first. Start with identity capture, two channels, and one holdout test. Buy a CDP when the test shows lift and manual connections become the bottleneck. Market research firms expect strong growth in the category (Mordor: USD 4.58 billion in 2026 to USD 13.14 billion by 2031), but a growing market says nothing about whether you need one now.
Is the “30% higher lifetime value” statistic accurate?
I could not trace it to a primary source. It is often credited to Harvard Business Review, but the HBR study I examined reports smaller, specific differences in spend and repeat visits. One white paper attributes the 30% figure to a 2015 IDC study I could not open. Use it only with that caveat.
Can smaller brands do omnichannel personalization?
Yes, at a smaller scope. Email, web and SMS connected around one trigger is a legitimate first stage. The break-even example above shows why scale matters for heavier programs.
How long until I know if it works?
At least one full purchase cycle for your category. For frequent-purchase brands, that may be weeks. For considered purchases, it can be months. A holdout that ends early proves nothing.
Why do these programs fail?
Most often because identity is not captured at the point of sale, because no one owns the customer across channels, and because attribution disputes end the budget before results arrive.
Glossary
- Identity resolution: matching records from different channels to one person.
- CDP (customer data platform): software that builds unified profiles and sends segments to other tools.
- Holdout: a randomly chosen group deliberately excluded from a treatment, used to measure incremental effect.
- Incrementality: revenue that would not have happened without the treatment.
- Suppression: stopping a message when it no longer applies, such as after a purchase.
- ITR (identified-transaction rate): share of transactions carrying a persistent customer identifier.
Corrections and changes in this update
- The CDP market forecast is now Mordor Intelligence’s USD 4.58 billion (2026) to USD 13.14 billion (2031). The earlier “$37 billion by 2030” contradicted the article’s own FAQ and the source.
- Third-party cookie status was corrected: Chrome kept them.
- Sephora’s Beauty Insider dates were corrected (launched 2007; Color IQ debuted 2012), and unsourced percentage lifts were removed.
- Unsourced claims about Starbucks retention, Nike Run Club data and store formats were removed.
- The 89% retention and 30% lifetime-value statistics are now presented with their actual origin and limits.
Sources
Research and analysts
- Sopadjieva, E., Dholakia, U. M., Benjamin, B. “A Study of 46,000 Shoppers Shows That Omnichannel Retailing Works.” Harvard Business Review, January 3, 2017. hbr.org (paywalled; excerpts read via BARE International).
- Aberdeen Group. Omni-Channel Customer Care, 2013, as reported by Digital Commerce 360, December 31, 2013.
- Medallia. Winning Customers in an Omnichannel World (cites IDC, 2015).
- McKinsey & Company. The value of getting personalization right—or wrong—is multiplying, 2021.
- Gartner. Gartner Predicts 80% of Marketers Will Abandon Personalization Efforts by 2025, December 2, 2019.
- Mordor Intelligence. Customer Data Platform Market 2031, GlobeNewswire, May 15, 2026.
- Twilio. State of Personalization Report 2022, June 2022.
Company data and reporting
- Starbucks. Q3 FY26 Digital IR Dashboard, July 7, 2026, and Q2 FY26 dashboard.
- Customer Experience Dive. Starbucks loyalty update driving frequency, membership grows (Q2 FY26 earnings call).
- Digital Commerce 360. Nike Digital sales, fiscal Q1 2026, October 1, 2025, and fiscal Q2 2026 coverage, December 2025.
- Chain Store Guide. Sephora Improves its Color IQ, October 2015; TIME, 2012, on the Sephora + Pantone Color IQ launch.
- Glossy. How Sephora is evolving its loyalty program; Modern Retail, September 2024, on Beauty Insider tiers.
Browser and privacy
- The Register. Google’s Privacy Sandbox, April 22, 2025.
- Engadget. Google has killed Privacy Sandbox, October 2025.
Last updated September 30, 2026. Figures are checked against the sources above as of that date; company results move quarterly.