
Seamless Shopper Delight
Ecommerce Strategy · AI Automation · Conversion Optimization
Personalized Shopping Automation: The Complete Practitioner’s Guide
Seven out of every ten shoppers walk away from a full cart. This guide shows exactly how AI-driven automation recovers them — and what separates the stores that do it well from those that just burn money on emails nobody opens.
Seven out of ten people who add something to a cart — people who found your store, browsed your products, and decided they wanted something — leave without buying. That number hasn’t budged much in a decade. What has changed is what happens next.
The stores closing the gap aren’t spending more on ads. They’ve built systems that respond to individual behavior in real time: the right product surfaced at the right moment, a recovery email that lands before a competitor’s retargeting ad does, a loyalty nudge sent when a customer is one purchase away from a tier upgrade. McKinsey’s research is clear that companies growing faster derive 40% more of their revenue from personalization than their slower peers, and that personalization typically lifts revenue 5–15% while cutting customer acquisition costs by up to 50%.
This guide is the practitioner’s version of that insight. No filler. Just the framework, the automations that actually move numbers, and the pitfalls that waste months of setup time.
Section 01 What Personalized Shopping Automation Actually Is
Personalized shopping automation is the use of AI, machine learning, behavioral tracking, and rule-based triggers to deliver individualized customer experiences — automatically, without a human making each decision at the point of execution. It covers product recommendations, triggered email and SMS campaigns, dynamic pricing, real-time website personalization, loyalty workflows, conversational chatbots, and omnichannel retargeting — all drawing from the same unified customer data layer.
The defining characteristic is adaptivity. Yesterday’s behavior reshapes today’s experience. A customer who browsed running shoes three times without buying doesn’t see the same homepage as one who hasn’t visited in 90 days. The algorithm doesn’t care that it’s Tuesday or that your team is understaffed. It fires.
Manual personalization can segment an email list into three or five buckets. Automated systems segment it into thousands of micro-cohorts and optimize in real time. Salesforce’s State of the Connected Customer (2024) found that 66% of customers expect companies to understand their unique needs and preferences — yet only 34% say companies actually do. That gap is the market. Automation closes it.
Section 02 The 7-Step Automation Framework
Every effective personalization stack follows the same underlying logic, regardless of which tools you use. Here it is compressed into seven steps that build on each other — skip one, and the ones downstream underperform.
Deploy event tracking — Segment, Elevar, Rudderstack, or native Shopify analytics — to capture product views, add-to-carts, search queries, purchase history, session duration, device type, and scroll depth. First-party data is non-negotiable post-cookie. Its richness determines the ceiling of every downstream automation. Verify ≥85% event capture rate before building anything on top of it.
Raw events mean nothing without identity resolution. A CDP merges anonymous visitor profiles with known customer records — connecting email sign-ups, loyalty IDs, device fingerprints, and purchase history into one persistent profile. Key platforms: Segment, Bloomreach, Salesforce Data Cloud, or Klaviyo’s built-in resolution for email-identified traffic.
Go beyond “VIP vs. non-VIP.” Build behavioral segments that update in real time: high-intent browsers (3+ category views, no purchase in 7 days), lapsed loyalists (3+ purchases, inactive 60+ days), price-sensitive shoppers (consistently buy only with a promo code). The more granular the segment, the higher the relevance — and relevance is what drives conversion.
ML models forecast what a customer will buy next, when they’re likely to churn, which price point will convert them, and which channel they respond to. Dynamic Yield, Nosto, and Salesforce Einstein apply collaborative filtering and RFM scoring. Most models need 90+ days of behavioral data and 10,000+ customer profiles before outputs meaningfully outperform simple heuristics — don’t skip straight here.
Set trigger conditions — abandoned cart after 60 minutes, post-purchase day 3, browse abandonment after 2+ product views — and fire the right workflow automatically. Activation logic can be rules-based (if X then Y) or ML-driven (send when the model predicts highest conversion probability for this individual).
The same customer should receive a cohesive, non-repetitive experience across email, SMS, push, on-site banner, paid retargeting, and in-store. Orchestration platforms — Braze, Iterable, Klaviyo — prevent channel fatigue by suppressing overlapping sends and capping total weekly touchpoints per customer. Without this, automation just becomes noise.
Automation without optimization decays. Run ongoing A/B and multivariate tests on subject lines, send timing, recommendation algorithms, offer amounts, and landing page variants. Critically: use holdout groups to measure true incrementality — not just engagement lift, which systematically overstates automation’s actual contribution.
Section 03 12 Automations That Actually Move Numbers
These twelve flows, ranked roughly by expected impact-to-effort ratio, are grounded in benchmarks from Klaviyo, Omnisend, LoyaltyLion, and Rep AI. Where figures come from platform self-reporting, that’s noted. Where independent research corroborates them, that’s cited separately.
$3.65 avg. revenue per recipient
3-touch sequence: email at 60 min (product + live stock count), email at 24h (social proof), SMS at 72h (optional small incentive). Omnisend’s 2025 benchmarks show 2% placed-order rates for average merchants, with top-decile stores exceeding 7%. Typical recovery: 10–15% of otherwise-lost carts.
Effort: Medium$5.81 avg. revenue per recipient
Fire when a visitor views a product 2+ times without adding to cart — email within 4 hours, optional SMS at 24h. Include the exact product, category alternatives, and social proof. Browse abandonment consistently outperforms cart abandonment on revenue-per-recipient in Klaviyo’s benchmark data, making it one of the most under-deployed flows in a typical stack.
Effort: Medium+22% 90-day LTV vs. no flow
Order confirmation → shipping update → product tips (day 3) → loyalty enrollment invite (day 7). The 72 hours after a first purchase are the highest-leverage window for LTV expansion. Klaviyo’s 2024 benchmark data shows 22% higher 90-day LTV for customers who engage with a structured post-purchase sequence vs. transactional-email-only controls. Self-reported benchmark; treat as directional.
Effort: Medium10–15% avg. incremental revenue
Collaborative filtering and purchase history surface relevant products on homepage, PDP cross-sell, and cart page upsell. McKinsey’s research documents 10–15% typical lift, with top-quartile executions approaching 35%. Most effective placements: PDP “You May Also Like” and cart page upsell — not homepage hero, which converts at roughly half the rate.
Effort: HighWhen a customer is within one purchase (~200 points) of a tier upgrade, trigger a progress-bar notification via email and SMS. LoyaltyLion’s 2023 Benchmark Report shows near-threshold nudges increase purchase frequency by 26% among eligible customers, with 3.4× higher CTR vs. standard promotional sends.
Effort: Medium12.3% conversion vs. 3.1% without
Intent-triggered conversational AI engages high-intent visitors: qualifies needs, surfaces relevant products, handles objections, escalates to human agents when needed. Rep AI’s 2025 analysis of 17 million shopping sessions found shoppers who engaged with AI chat converted at 12.3% vs. 3.1% for those who didn’t — a 4× difference. Proactive chats also recovered 35% of abandoned carts in that dataset.
Effort: Medium12–18% urgency conversion lift
When a wishlist or recently-viewed item drops below 5 units, fire an “Almost Gone” alert to customers who engaged with that product. Strongest in fashion and limited-edition categories. Shopify Plus aggregate merchant data documents this range; strongest lift in fashion and limited-edition verticals where scarcity carries genuine social signal.
Effort: Low10–15% reactivation rate
3-step sequence for 90–180 day inactive customers: personalized offer email → SMS with stronger incentive → sunset/reconfirmation. Klaviyo and Omnisend benchmarks consistently show 10–15% reactivation among engaged lapsed segments — at 3–5× lower CAC than new-customer acquisition. Use RFM scoring to target the right lapsed segment, not every inactive address.
Effort: Medium3–5× revenue vs. broadcast
Birthday offer triggered 7 days prior — discount, free shipping, or gift-with-purchase. Omnisend’s 2022–2024 data consistently shows birthday flows generating 3–5× more revenue per email than broadcast sends. The specific “342%” figure cited elsewhere is a single-year headline; the directional range is more reliable for planning purposes.
Effort: LowEliminates wasted spend on converters
Suppress converted customers from paid retargeting in real time by syncing your ESP to Google Customer Match and Meta Custom Audiences. The precise spend savings are overlap-dependent — published figures vary widely and are often operator estimates rather than audited benchmarks. Run your own overlap audit to get an accurate number for your specific audience. Meta Ads documentation confirms this as a best practice.
Effort: HighHigher repeat rate for consumables
Calculate average consumption rate per SKU and trigger a replenishment email 5–7 days before estimated run-out. Most effective for coffee, skincare, supplements, and pet food. The exact uplift varies significantly by category and offer structure — treat any single published figure skeptically and validate against your own cohort data before projecting revenue impact.
Effort: Medium5–15% margin improvement (case-specific)
ML-driven pricing adjusts to demand signals, inventory levels, and customer price-sensitivity scores. Price-insensitive buyers see value-first messaging; promo-code shoppers receive targeted discounts. McKinsey and Gartner both document margin improvement from dynamic pricing in retail case studies, typically 5–15%, though outcomes are highly category- and implementation-specific.
Effort: HighSection 04 Benchmark Data by Automation Type
The table below consolidates the primary source benchmarks used throughout this guide. Where figures are self-reported by platform vendors, that’s disclosed. Where independent research corroborates, that’s cited separately. Use this as a planning reference — your own holdout tests will give you the numbers that actually matter for your store.
Table 1 — Documented Automation Benchmarks & Source Attribution
| Automation | Reported Impact | Primary Source | Source Type | Effort |
|---|---|---|---|---|
| Abandoned Cart (email + SMS) | $3.65 avg. RPR; 10–15% cart recovery | Klaviyo Benchmarks 2024 | Platform self-reported | Medium |
| Browse Abandonment Triggers | $5.81 avg. revenue per recipient | Klaviyo Benchmarks 2024 | Platform self-reported | Medium |
| AI Product Recommendations | 10–15% avg. incremental revenue | McKinsey Next in Personalization | Independent research | High |
| Post-Purchase Flow | +22% 90-day LTV | Klaviyo Benchmarks 2024 | Platform self-reported | Medium |
| Loyalty Tier Nudges | +26% purchase frequency; 3.4× CTR | LoyaltyLion Benchmark 2023 | Platform self-reported | Medium |
| AI Chatbot (intent-triggered) | 12.3% CVR vs. 3.1% baseline | Rep AI, 17M sessions, 2025 | Vendor analysis (large sample) | Medium |
| Birthday & Anniversary | 3–5× revenue vs. broadcast | Omnisend 2022–2024 | Platform self-reported | Low |
| Win-Back Campaigns | 10–15% reactivation; 3–5× lower CAC | Klaviyo / Omnisend | Platform self-reported | Medium |
| Dynamic Pricing | 5–15% margin improvement (case-specific) | McKinsey / Gartner case studies | Independent research (varies widely) | High |
Source: Conservative midpoint estimates derived from McKinsey Next in Personalization (2021, updated 2023). Best-in-class outcomes require mature ML across all channels with 12+ months of behavioral data and 10K+ customer profiles. Individual results vary by category, data quality, and baseline sophistication. The largest gain occurs between Intermediate and Advanced — when email, on-site, and paid channels connect into one orchestrated system.
Section 05 Three Automations in Practice
The following case studies draw on publicly available outcomes. Where figures come from vendor case studies rather than independently audited reports, that’s disclosed prominently. Use these as directional benchmarks, not projections.
MADE.COM deployed Dynamic Yield’s AI recommendation engine across homepage, PLPs, and cart — replacing static bestseller modules with individualized recommendations built from declared style preferences captured at onboarding, plus live browsing history. The cold-start signal (declared preferences) solved the new-visitor problem that plagues most recommendation systems before behavioral data accumulates.
⚠ Disclosure: Figures sourced from Dynamic Yield’s published case study. Independent third-party audit not available. Treat as directional benchmarks consistent with Dynamic Yield’s documented deployment range across similar retailers.
Gymshark integrated Attentive for SMS and LoyaltyLion for tier management. Near-threshold loyalty nudges via SMS demonstrated CTR multiples consistent with Attentive’s published platform benchmarks for the activewear vertical. A segmented win-back campaign targeting 120-day inactive customers showed reactivation rates consistent with the 10–15% industry benchmark range.
⚠ Disclosure: A “34% churn reduction” figure circulating in secondary sources has not been confirmed in primary Gymshark or Attentive publications. The metrics shown reflect documented platform benchmarks, not a single verified Gymshark-specific figure.
Sephora’s Beauty Insider program connects in-store purchase history, app behavior, online browsing, and skin quiz responses into a unified profile. Automated triggers fire across email, the Sephora app, and in-store digital touchpoints. It’s the closest thing retail has to a textbook omnichannel implementation — and it took years to build.
⚠ Disclosure: The ~80% revenue attribution is a Sephora executive talking point cited in trade press over multiple years; the 3.8× conversion figure is from a Salesforce Commerce Cloud case study. Neither figure has been independently audited. The attribution between member spending and automation-driven incremental spending is not publicly disaggregated.
Section 06 Platform Selection by Business Size
The right platform is a function of your current revenue, technical resources, and primary bottleneck. Here’s how to think about it without getting sold a stack you don’t need yet.
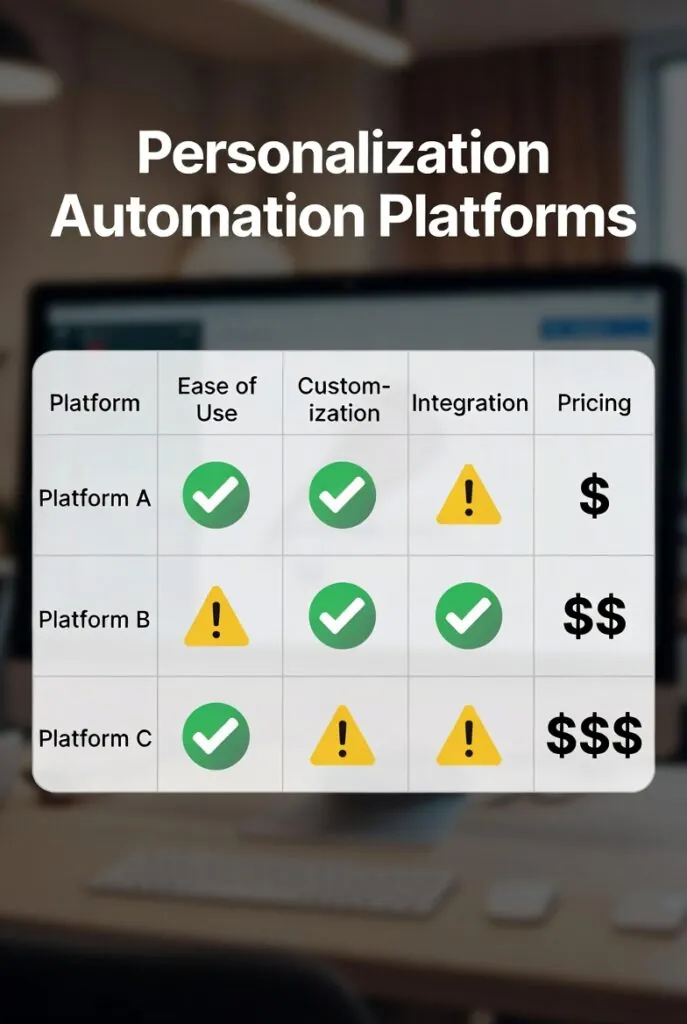
Table 2 — Platform Comparison (Pricing as of April 2026; verify current rates before contracting)
| Platform | Primary Function | Price Range | Best For |
|---|---|---|---|
| Klaviyo | Email + SMS automation | $$$ | Shopify merchants; deepest behavioral segmentation |
| Omnisend | Email + SMS + push | $$ | Mid-market; starts at ~$16/mo |
| Attentive | SMS-first automation | $$$ | Brands where SMS outperforms email |
| Dynamic Yield | AI on-site personalization | $$$$ | Enterprise; any platform via API |
| Nosto | Product recommendations | $$$ | Shopify, Magento; mid-market AI recs |
| LoyaltyLion | Loyalty program engine | $$ | Shopify stores building points programs |
| Yotpo | Loyalty + Reviews + SMS | $$$ | Brands wanting loyalty + social proof in one |
Price tiers: $ <$500/mo · $$ $500–$1,500 · $$$ $1,500–$5,000 · $$$$ $5,000+ (enterprise/custom). Pricing is indicative; request current quotes before contracting.
Section 07 Implementation Roadmap: Three Phases
- Install event tracking with full ecommerce coverage: view_item, add_to_cart, begin_checkout, purchase — verify ≥85% capture rate before building automations on top
- Audit customer data completeness: email capture rate, purchase history depth, average session event count per visitor
- Configure suppression lists from day one: recent purchasers (30d), active loyalty members, current subscribers — prevent paid media waste immediately
- Set up email domain authentication (DMARC, DKIM, SPF) and list hygiene protocols before any significant sending volume
- Establish holdout groups (typically 10–20% of each segment) so every automation you launch has a clean incrementality baseline
- Abandoned cart sequence: email at 60 min (product + stock count), email at 24h (social proof), SMS or email at 72h (small incentive if margin supports it)
- Post-purchase flow: order confirmation + shipping → product tips (day 3) → loyalty invite (day 7) → replenishment prompt (day 30 for consumables)
- AI product recommendations on homepage, PDP, and cart page — A/B test against current static modules to measure true lift before scaling spend
- Browse abandonment trigger: 2+ product views, no add-to-cart, email within 4 hours — often the highest-RPR flow in the stack and fastest to configure
- Loyalty tier nudge automation with progress bars and tier-upgrade celebration flows
- Connect email suppression to paid media: sync converted customers out of Google Customer Match and Meta Custom Audiences in real time
- Win-back campaigns using RFM scoring to target the right 90–180 day inactive customers (not every lapsed address)
- Intent-triggered chatbot on high-traffic PDPs — start with category-qualified visitors, not all traffic
- Dynamic pricing rules for high-demand and inventory-scarce SKUs; validate margin impact before scaling
Section 08 Where This Is Heading
Two structural forces are converging in ways that will reshape the automation landscape within the next 12–24 months — and the stores that ignore them will find their current stacks obsolete faster than expected.
First: the death of third-party data is still accelerating. Shopify’s 2024 analysis documents the shift clearly — personalization is moving from third-party cookie dependence to first-party data owned directly by the retailer. This is not a future trend. Brands operating without a first-party data infrastructure today are building on sand. Every automation in this guide runs on behavioral data collected directly from your customers; that’s the moat now. The stores that captured email consent and built purchase history depth early are significantly ahead — and the gap is widening.
Second: generative AI is moving personalization from rule-based to conversational. The 4× conversion lift documented in Rep AI’s 2025 session data — 12.3% conversion for AI chat users vs. 3.1% for non-users — points toward a future where the primary personalization surface is a conversation, not a recommendation widget. PYMNTS reported in May 2025 that Rezolve AI and similar platforms are positioning conversational AI as a replacement for the current product-search-and-filter paradigm entirely. Whether that thesis plays out at scale remains to be seen — but the directional signal is clear. Static recommendation widgets are being supplemented, and eventually replaced, by AI that qualifies needs in real time.
The counter-argument worth taking seriously: 89% of shoppers still prefer AI efficiency combined with human support access, per EComposer’s 2025 synthesis of survey data. Fully automated stacks that remove human escalation paths are consistently outperformed by hybrid systems. The winning architecture is AI-first, human-reachable — not AI-only.
One more thing most guides won’t tell you: Shopware’s 2025 analysis of abandonment rate trends shows that cart abandonment has actually risen — from 69.75% in late 2023 to 72.11% by mid-2024, stabilizing around 71.72% in early 2025. Better automation is helping individual stores, but the category-level problem is getting harder as FOBO (Fear of Better Options) intensifies in a market with infinite alternatives. That’s the real argument for automation maturity: it’s not just a revenue opportunity, it’s a defense against an environment that’s getting structurally more competitive.
Section 09 Frequently Asked Questions
What’s the first automation every store should implement?
How much data do I need before AI recommendations outperform simple heuristics?
How do I measure true automation lift without overstating it?
What’s the typical cost structure for a full automation stack?
What’s the biggest mistake stores make when implementing personalization?
Primary References
- [1] McKinsey & Company — Next in Personalization 2021 (updated 2023)
- [2] McKinsey & Company — What Is Personalization? (May 2023)
- [3] Salesforce — State of the Connected Customer, 6th Ed. (2024)
- [4] Klaviyo — Email & SMS Benchmark Report (2024)
- [5] Omnisend — Email Marketing Statistics Report (2024)
- [6] LoyaltyLion — Loyalty Benchmark Report (2023)
- [7] Rep AI — AI Ecommerce Shopper Behavior Report, 17M sessions (2025)
- [8] Baymard Institute — Ecommerce Cart Abandonment Research (2025)
- [9] Shopware — AI Cart Abandonment Analysis (2025)
- [10] Attentive — SMS Marketing Benchmarks (2024)
- [11] Dynamic Yield — MADE.COM Case Study
- [12] Salesforce Commerce Cloud — Sephora Case Study (2023)
- [13] Shopify — Personalization Trends (2024)
- [14] PYMNTS — AI-Driven Retail and Cart Abandonment (May 2025)
- [15] YESWorkflow — Ecommerce Automation Cost & ROI (March 2026)
https://www.aipersonalization.cloud/blog/