



Real-Time Engagement Tools: What Actually Keeps Users Hooked (and Three Numbers to Stop Quoting)
Updated September 30, 2026 · About 10 minutes · Aipersonalization Editorial
The short version. Real-time engagement tools work, but the three statistics most often used to sell them are misread, mislabeled or untraceable. The best-supported finding in this space is a cost (short-form video use tracks with weaker attention), not a benefit. If you budget from the popular numbers, you will overspend on identity resolution, overestimate live commerce, and fund gamification with no way to prove it works.
Contents
- The attention statistic that never existed
- The engagement gap is real, but the usual explanation is not proven
- The 7.87× retention figure measures who logs in, not what you did
- Live commerce: strong conversion, thin margins, small market
- Gamification: the evidence gap
- Do these three tools compound?
- The cost side: what the attention research shows
- What to do Monday morning
- FAQ
- Sources and method
The attention statistic that never existed
The claim: humans now hold attention for 8 seconds, down from 12 in 2000, worse than a goldfish. Versions of this circulate with even more precise numbers (7.6 seconds, 45,000 participants, a 36.7% drop). I could not find those specifics in the source they are attributed to.
What the source actually is: a 2015 Microsoft Canada consumer-insights report. It surveyed 2,000 Canadians with game-like attention tasks and recorded EEG for 112 participants. The 12-second, 8-second and goldfish graphic on one page is credited to the website Statistic Brain, not to Microsoft’s own experiment. Reporting by Temple Law’s Advocacy and Evidence Resources and a recent ScienceBlog review both reach the same conclusion: there is no traceable experiment behind the eight-second figure.
Judgment. Do not build a strategy on “8 seconds.” Attention is task-dependent; there is no single human number. What is defensible is narrower: on feed-based platforms, the first moments decide whether a piece of content survives, because the feed decides for the user.
The engagement gap is real, but the usual explanation is not proven
The most-cited 2025 benchmark is the Socialinsider study of 70 million posts from international brand accounts (January 2024 to December 2025). Note the attribution: it is Socialinsider’s, not Sprout Social’s, as some summaries state.
| Platform | 2025 avg. engagement rate | Change vs. 2024 |
|---|---|---|
| TikTok | 3.70% | +49% |
| 0.48% | about -4% | |
| 0.15% | flat | |
| X | 0.12% | about -20% |
Source: Socialinsider Social Media Benchmarks 2026. Rates are calculated per post relative to followers.
Two corrections to the version of this table that circulates:
- Instagram is 0.48%, not “about 1.5%.”
- The TikTok lead has already narrowed. Socialinsider’s 2026 update puts TikTok’s follower-based rate around 2.6% to 2.7%, roughly 10% down year over year.
The arithmetic: 3.70 ÷ 0.15 is about 25× (TikTok vs. Facebook) and 3.70 ÷ 0.48 is about 7.7× (TikTok vs. Instagram).
Non-obvious point (analysis, not a sourced finding). The metric divides engagement by followers. TikTok’s feed routinely shows videos to people who do not follow the account, so much of the “engagement gap” may reflect how the platform distributes content, not how much more attentive its users are. Comparing 3.70% on TikTok with 0.15% on Facebook compares two different denominators. Treat the gap as evidence about distribution architecture, and use per-view or per-reach rates when you compare your own channels.
The 7.87× retention figure measures who logs in, not what you did
This is the single most quoted number in the category, and the one most worth understanding. From Braze’s 2025 Global Customer Engagement Review (Braze customer data):
| Retention window | Known users | Anonymous users | Braze’s stated “uplift” | Ratio from the raw rates |
|---|---|---|---|---|
| 30 days | 59.79% | 18.09% | 2.31× | 3.3× |
| 365 days | 13.05% | 1.47% | 7.87× | 8.9× |
I recomputed both ratios from Braze’s published rates. The stated “uplift” equals the ratio minus one (a +231% and +787% change), not the ratio itself. So “7.87× more likely to be retained” is a labeling slip: the raw figures imply roughly 8.9×. That does not weaken the finding; it corrects the sentence people repeat. It also means anyone who has quoted “2.3× at 30 days” has understated the raw gap, while anyone reading “7.87× more likely” literally has misread the base.
Three things matter more than the labeling:
- It is a correlation with a selection problem. Users who create an account or log in are, on average, the users who already intended to come back. Converting an anonymous user to a known one does not automatically create that intent. Braze’s data cannot separate “identification causes retention” from “retained-type users are the ones who identify.”
- The absolute numbers are sobering. Even known users retain at 13.05% after a year.
- It is vendor data. Braze sells the platform whose value the statistic supports. It is first-party data across its customer base, not an independent audit. A newer 2026 edition (779 customers, 6 billion profiles, 2025 data) exists; I verified its privacy findings but did not confirm whether it updates this ratio.
There is a genuine trust constraint on the demand side. The same 2026 review reports that 43% of surveyed consumers would stop engaging with a brand entirely if it misused their personal data.
Judgment. Identity resolution is probably worth doing, but the 7.87× figure is not the business case for it. The business case has to come from an experiment you run yourself (see the test plan below).
Live commerce: strong conversion, thin margins, small market
What the sources support. McKinsey’s analysis of Chinese live commerce reports conversion rates approaching 30%, up to ten times conventional e-commerce, with the German retailer Douglas reporting up to 40%. That is a 2021 report drawing largely on China. A commonly repeated range of 9% to 30% versus 2% to 3% for standard e-commerce is attributed to Firework, a live-video vendor, in an eMarketer FAQ.
What I could not verify. Claims that “consultation” formats convert at 40% to 70% trace to vendor material, not to McKinsey or any independent study I could find. I removed them.
The U.S. market is real but small. eMarketer estimates U.S. livestream commerce grew nearly 50% in 2025 to $14.64 billion, with 21.7% of U.S. digital buyers purchasing via livestream and 43% of U.S. adults saying they neither use nor want it. A CNBC report from September 2026 cites eMarketer forecasting nearly $20 billion this year (about 35% growth). eMarketer’s own commentary calls livestream a “tiny drop” in U.S. e-commerce, more useful for engagement and community than as a sales engine. One more datapoint against the hype: TikTok Shop’s livestream share of its sales fell from 26% to 18% between July 2024 and July 2025 (Charm.io via Modern Retail, as cited by eMarketer).
The conversion number hides the real question: margin
Live events usually run on time-limited offers. A conversion rate that looks like 5× can still lose money if it is bought with discounts. I computed the order-volume multiple a discounted live event needs just to match the gross profit of undiscounted sales:
Required volume multiple = gross margin ÷ (gross margin − discount), both as a share of list price. It ignores host cost, platform fees and returns, so real break-evens are higher.
| Gross margin | 10% off | 20% off | 30% off |
|---|---|---|---|
| 30% | 1.5× | 3.0× | not reachable (margin gone) |
| 40% | 1.3× | 2.0× | 4.0× |
| 50% | 1.25× | 1.7× | 2.5× |
Read it this way. A product with 40% gross margin sold at 20% off must double its orders just to stand still on gross profit. Live conversion figures are also measured on a self-selected audience that has already chosen to watch a shopping stream, so they are not directly comparable with whole-site conversion.
Where I land: for U.S. brands, run live commerce as a community and awareness channel first. Judge the first events on returning viewers, watch time and comment rate, as eMarketer suggests, and only then on revenue.
Gamification: the evidence gap
The article this one replaces cited large gamification lifts (100% to 150% higher engagement, 12× more shares, a 22% retention gain) and a “27% of Gen Z find loyalty programs not fun” statistic. I could not trace any of them to a primary source, so they are gone. Market-size figures for gamification vary widely between research firms and are of little use for deciding what to build.
What remains is a mechanism argument, and it should be labeled as one. Streaks and progress bars borrow loss aversion: people dislike breaking a chain more than they value adding a link. That can raise activity. It does not prove that activity is what the user, or your business, wants. The failure mode is measurable and common: a metric like daily active users climbs while the outcome you care about (course completed, purchase repeated, goal reached) stays flat.
Judgment. Treat every gamification mechanic as a hypothesis with a kill condition. If it lifts activity and not the outcome metric inside a fixed window, remove it. The industry’s lack of independently audited lift numbers is a reason to run your own holdout, not a reason to trust the vendor’s.
Do these three tools compound?
The popular claim is that personalization, gamification and live commerce reinforce each other inside one AI decisioning layer. No source I checked tests this. Each of the three has separate evidence of varying strength, and none of it measures the combination. The claim is a reasonable hypothesis: personalization decides who sees a mechanic, and the mechanics act on different behaviors (identity, habit, purchase). It is not a finding.
What data would resolve it: a factorial experiment with independent holdouts for each tool (personalization on/off × gamification on/off × live invitations on/off), measured on 90-day retained revenue per user. Until someone publishes that, “compounding” should not appear in a business case.
The cost side: what the attention research shows
The strongest peer-reviewed evidence in this whole topic concerns a downside. A Psychological Bulletin meta-analysis (Nguyen et al., 2025; 71 studies, 98,299 participants) found that heavier short-form video use was associated with poorer cognition overall (r = -.34), with attention (r = -.38) and inhibitory control (r = -.41) showing the strongest links.
Read the limits before you quote it:
- Mostly correlational. About 87% of the included studies were correlational, so the review cannot show that video use causes worse attention. It could equally be that people with weaker self-control watch more.
- Skewed sample. Roughly 74% of studies were conducted in Asia.
- Thin experimental record. Some longitudinal experiments in the review found no significant change after short-form video use.
- Not about “engagement tools” as a class. It concerns short-form video use, not personalization or loyalty design.
Why it still matters for you: if your growth model depends on feed-style compulsion loops, your risk is reputational and regulatory before it is scientific. That is a judgment, not a citation: I did not find a regulator action tied to this specific paper, so I dropped the earlier claim that EU and UK bodies were acting on it.
What to do Monday morning
1. Prove identity resolution before funding it. Randomize a value-exchange sign-up prompt (saved carts, order tracking, price alerts) to a share of anonymous visitors and hold the rest out. Compare 90-day retention between the whole randomized groups, not just the people who registered. If the difference is small, the 7.87× was a selection effect in your product too.
2. Compare channels on reach, not followers. Recalculate your engagement rates per view or per reach before you shift budget toward any platform because of the 25× headline.
3. Price-test live commerce before building studio infrastructure. Run two events: one with no discount, one with a discount you have run through the break-even table. If only the discounted event “works,” you have bought volume, not demand. Track returning viewers as the lead metric.
4. Give every gamification feature a written kill condition. Name the outcome metric, the window and the holdout size before launch. If activity rises and the outcome does not, remove it.
5. Pull one number from your slide decks today. Search your own materials for “8 seconds,” “7.6 seconds” and “7.87×” and replace them with the corrected versions above.
FAQ
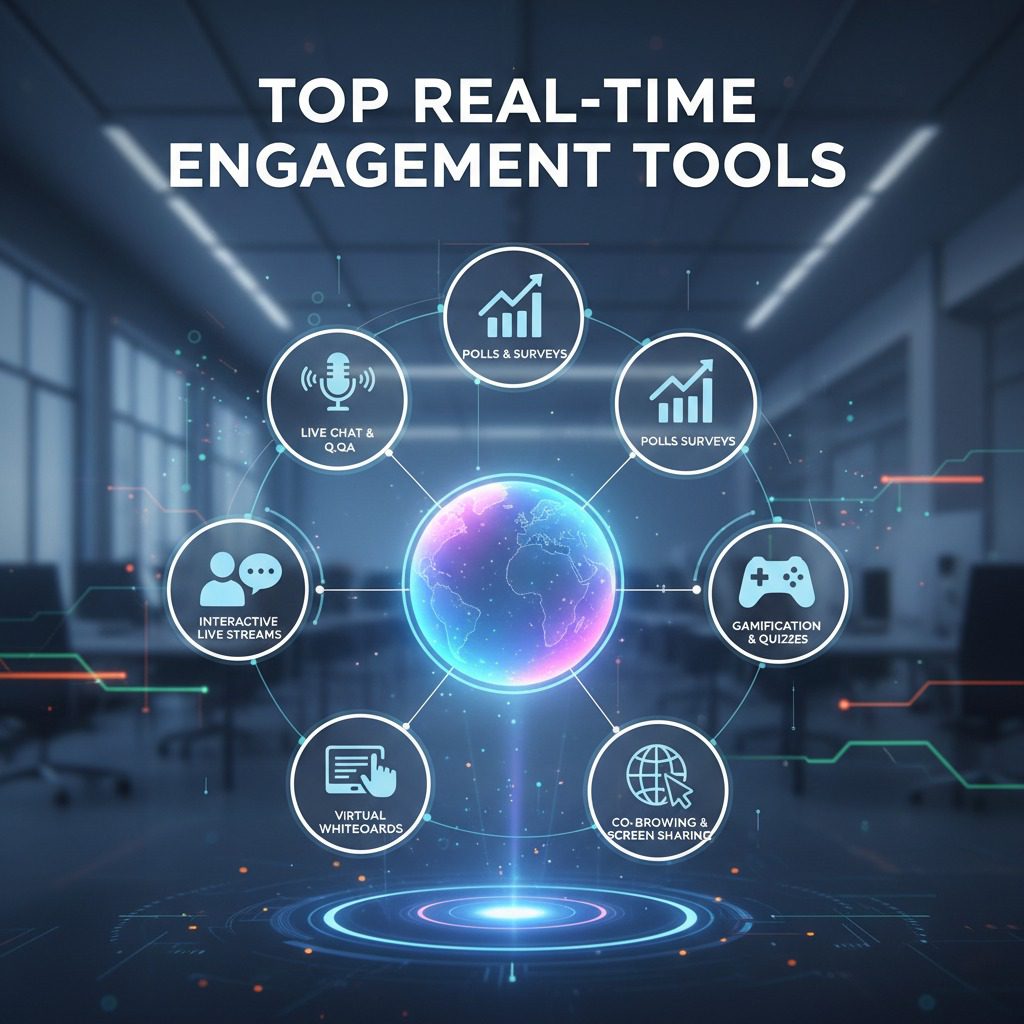
What are real-time engagement tools? Software that changes what a user sees or is offered based on their behavior as it happens: personalization and decisioning engines, gamification mechanics (streaks, points, progress) and live shopping formats.
Is the human attention span really 8 seconds? No. The figure traces to an unsourced graphic in a 2015 Microsoft Canada report, not to a traceable experiment. Attention varies by task.
Do known users really retain 7.87× better than anonymous users? In Braze’s 2025 data, known users retained at 13.05% after a year versus 1.47% for anonymous users, a raw ratio of about 8.9×. The gap is correlational, and the data is from a vendor.
Does live commerce convert better than regular e-commerce? Reported rates are higher (McKinsey cites rates approaching 30% in China; a vendor cites 9% to 30% against 2% to 3%). Discounts, self-selected audiences and small U.S. adoption limit how far those numbers travel.
Does short-form video harm attention? A large meta-analysis finds an association between heavy use and poorer attention and inhibitory control. Because most included studies are correlational, it does not establish cause.
Sources and method
How I checked. I traced each headline figure to the most primary source I could reach: the Braze retention table, the Socialinsider benchmark, the McKinsey report text, eMarketer’s published forecasts and the Psychological Bulletin paper’s abstract and results. I recalculated the Braze ratios and built the break-even table myself. I ran no experiments and interviewed no one.
Evidence strength, strongest first:
| Rank | Source | Type | Main limitation |
|---|---|---|---|
| 1 | Nguyen et al., Psychological Bulletin (2025) | Peer-reviewed meta-analysis | Correlational; skewed to Asian samples |
| 2 | eMarketer U.S. livestream forecasts | Analyst estimates | Forecast, refreshed periodically |
| 3 | McKinsey, It’s Showtime! (2021) | Consultancy analysis | Dated; China-centered; companies self-reported rates |
| 4 | Socialinsider 70M-post benchmark | Vendor benchmark | Brand accounts only; follower-based denominator |
| 5 | Braze Customer Engagement Review | Vendor first-party data | No independent audit; selection effects |
| 6 | Firework conversion range | Vendor claim | Commercial interest; methodology not stated |
Reference list
- Nguyen, L., Walters, J., Paul, S., et al. (2025). Feeds, feelings, and focus: A systematic review and meta-analysis of the cognitive and mental health correlates of short-form video use. Psychological Bulletin, 151(9), 1125–1146. Full text
- Braze. Building a retention machine: 6 data-driven insights (2025 Global Customer Engagement Review data); 2026 Customer Engagement Review
- Socialinsider. Social Media Benchmarks 2026
- McKinsey & Company. It’s showtime! How live commerce is transforming the shopping experience (2021)
- EMARKETER. FAQ on livestream commerce: What marketers need to know about live shopping in 2026
- CNBC. Livestream shopping is gaining steam in the U.S. (September 1, 2026)
- Temple Law, Advocacy and Evidence Resources. Are we no better than goldfish? (2024); ScienceBlog. Humans do not have a scientifically established eight-second attention span
Related reading on AInvasion
- Short-form strategy guide
- First-party data strategy overview
- Identity resolution implementation guide
- Live commerce platform selection guide
- Gamification design principles
Vendor-reported figures are labeled as such. No independent audit of vendor data was performed by this publication.