

Last reviewed November 2026 · 15 min read · Practitioner level
Short answer: Personalized UX design adapts what an interface shows, how it is organized, or how it behaves to the individual user, using stated preferences, observed behavior, or context. The approaches that hold up in practice are modest: one branching question in onboarding, navigation that stays put while emphasis adapts, and controls the user can see. Most failures come from models running on weak signals with no way for the user to correct them.
Picture two people opening the same dashboard on the same morning. One signed up an hour ago and needs to find the single action that proves the product works. The other has used it daily for three years and wants the raw filter panel that the first person would find hostile. A default layout serves one of them badly, and usually serves both of them badly.
That gap is what personalized UX design tries to close. This guide covers what the term means, what the evidence says about whether it pays off (and where that evidence is thin), eight strategies with real documented examples, how to decide between rules and models, where personalization breaks, and how to measure it without fooling yourself.
In this guide
- What personalized UX design is
- Does it pay off? The evidence, with caveats
- Which signals to trust first
- Eight strategies
- Rules or models?
- Where personalization breaks
- Privacy, consent and the control surface
- Tools by maturity stage
- Measuring what matters
- FAQ
- Takeaways by role
- Sources and evidence grades
What personalized UX design is
Personalization is when the system adapts the experience to a user based on what it knows. Customization is when the user adapts it manually. The difference matters because customization hands the work to the person least equipped to do it, while personalization puts the work on the product team, where it belongs.
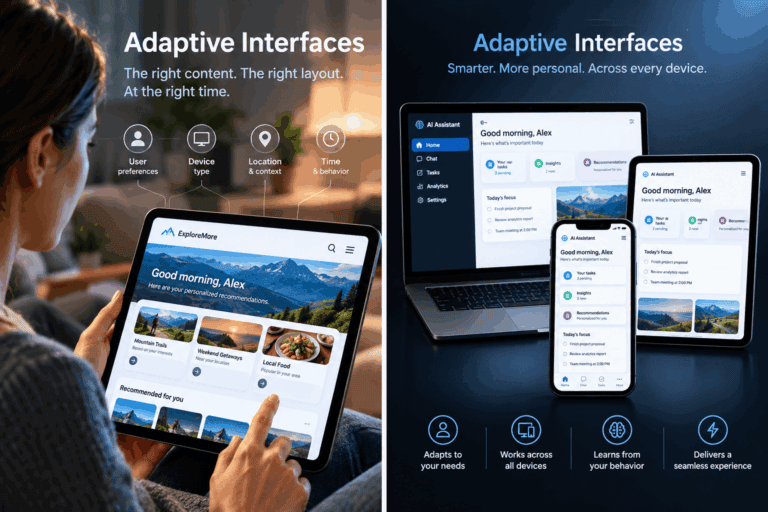
Personalization is not the same as inserting a first name into a banner. A useful test: would this user, shown a screenshot of what a different user sees, notice a meaningful difference in structure, content, or behavior? If the only difference is a name, it is decoration.
Four working types
The table below is a working taxonomy used in this guide, not an industry standard. Teams tend to conflate these types, which leads to building the wrong thing well.
| Type | What drives it | Typical use | Where it breaks |
|---|---|---|---|
| Contextual | Device, time, location, referral source, session state | Responsive density, simplified mobile flows | Conflicting signals, such as a desktop browser on a phone, or a traveler whose location changes |
| Preferential | Settings, onboarding answers, profile data | Role-based layouts, language, notification choices | Stated preferences that the interface then fails to remember |
| Behavioral | Feature usage, click paths, abandonment | Feature discovery, onboarding branches | Users change behavior and the model does not update |
| Predictive | Patterns from similar users, sequence models, intent signals | Recommendations, next-action suggestions | New users with no history, sparse data, compounding bias |
Most teams should start with preferential and contextual personalization. They are the easiest to explain to users and need no machine learning.
Does it pay off? The evidence, with caveats
Personalization statistics circulate in a lot of marketing content with their context stripped off. Here is what the most-cited sources actually measured.
| Source | Finding | Sample and date | How to read it |
|---|---|---|---|
| McKinsey, Next in Personalization 2021 | 71% of consumers expect personalized interactions; 76% get frustrated when they don’t get them | US adults, n = 1,013, surveyed Sept 7-8, 2021 | Stated expectations from a consultancy survey, now five years old |
| McKinsey, same report | Faster-growing companies derive 40% more of their revenue from personalization than slower-growing ones | Company-level analysis in the same report | A correlation between growth and personalization share. It does not show that personalization caused the growth |
| Epsilon / GBH Insights | 80% of respondents said they are more likely to do business with a company offering personalized experiences; 25% called personalized offers “creepy”; 32% said personalization isn’t worth giving up privacy | 1,000 consumers aged 18-64, 2017 survey, published January 2018 | Stated intent, not observed purchases. The privacy figures come from a secondary summary |
| Twilio, State of Customer Engagement 2025 | 84% of consumers would prefer to adjust their personalization settings themselves; only 15% “absolutely” trust brands with their data | 7,640 consumers and 637 business leaders, 18 countries, fielded Jan 3 to Feb 17, 2025 | Vendor survey; Twilio sells customer-engagement products. The 15% figure comes from a trade-press summary |
Three honest conclusions follow.
First, the demand side is consistent across sources and years: people say they expect relevance. Second, none of these studies isolates the causal effect of a specific UX change on revenue, which is why the strongest evidence for any single tactic is your own holdout test (see Measuring what matters). Third, the two sources that measure trust, Epsilon and Twilio, both point the same way: people want the benefit and want control over how it is produced.
Which signals to trust first
Before choosing tactics, rank your inputs. This ordering is editorial judgment based on how reliably each signal reflects the individual, not a published standard.
- Explicit stated preferences. What the user directly chose. Lowest volume, highest trust. An algorithm should not override a setting a user deliberately picked.
- Completed behavioral actions. Features used, tasks finished, content consumed. These reveal preferences that people often don’t report accurately.
- Attempted or abandoned actions. Started flows that stalled. Useful for locating friction, but ambiguous about cause.
- Contextual signals. Device, time, location. Useful for layout and copy density, brittle for anything deeper.
- Cohort inference. What similar users did. Use it when an individual has generated little data, and stop using it once they generate their own.
The most common structural mistake is inverting this order: applying cohort assumptions to someone who has already told the product, through settings or behavior, who they are. Twilio’s finding that 84% of consumers would rather adjust personalization themselves is consistent with rule one.
Eight strategies
1. Branch onboarding on one question
Ask the single question whose answer most changes what the user needs (role, goal, or experience level) and route to a flow that skips what doesn’t apply. Someone who says they want to track personal expenses should not see portfolio-management screens during setup.
This is rule-based personalization, and it needs no model. No verified public benchmark exists for the size of the effect, and figures quoted for it online are usually unsourced. Treat it as a hypothesis, run it as an A/B test, and measure activation against the single-flow control.
2. Personalize inside a fixed frame
Duolingo’s documented approach is a good model. Its courses have a predetermined structure: a sequence of lessons, each with a pool of exercises. Its Birdbrain model then decides which exercises from that pool fit a given learner’s level, and a separate model decides when to bring back previously learned material. The frame is stable; the selection inside it adapts.
Duolingo’s own blog post introducing Birdbrain reports that A/B tests showed lessons built with the model helped learners learn more and return more often, and that it was personalizing over 20% of lessons at the time of writing. That is first-party evidence from the company that built it, so weigh it accordingly. The design lesson is independent of the numbers: users keep a stable mental map of the product while the content inside it fits them.
3. Let a bandit choose presentation, not structure
Netflix described its artwork personalization in a December 2017 post on its technology blog. For each member, the system selects which image represents a title, framed as an online learning problem solved with contextual bandits, which balance gathering fresh test data against exploiting what has already been learned.
The same write-up is candid about the hard parts: a title launching with no data (cold start), and the open question of whether changing a title’s artwork between sessions helps or confuses the member. Presentation-level choices like thumbnails, headlines, and ordering suit this treatment because a wrong choice is cheap and the feedback is fast. Structural choices, like where the settings menu lives, do not.
4. Keep navigation stable and adapt emphasis
Nielsen Norman Group’s guidance on progressive disclosure is often cited in support of personalization, so it is worth being precise about it. Progressive disclosure shows the few most important options first and defers advanced ones to a secondary level that users open themselves. NN/g says it improves learnability, efficiency of use, and error rate, and notes that designs with more than two levels tend to have low usability.
That is a fixed design, not an adaptive one. It does not say that interfaces should reconfigure themselves by inferred expertise. Jakob Nielsen’s later write-up on the technique warns against confusing it with adaptive menus that reshuffle options by recent usage, because they break spatial memory: the command found yesterday has moved today. The practical rule is to personalize how much is expanded, and avoid moving where things live.
If you want expertise-based adaptation, do it with explicit opt-ins (“Show advanced options”) or by pre-expanding a panel for users who have used it before, with the control always in the same place.
5. Match the register
Microcopy, error messages, and empty states can shift tone by audience without changing the interface. A compliance officer and a freelancer may use the same feature and want different words: precision and accountability for one, speed and plain language for the other. This is cheap to build (a copy variant keyed to a role) and low-risk, since the layout never changes.
6. Time nudges to intent, not to the calendar
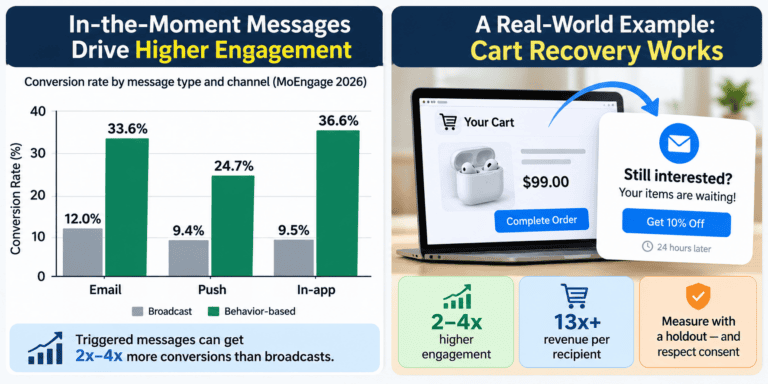
A prompt sent while a user is stuck on a step you have diagnosed is help. The same prompt sent on a fixed “day 7” drip schedule is noise. Trigger in-product prompts and emails from events (a failed search, an abandoned import, a feature opened three times without completing), and cap frequency so a nudge never repeats after the user has acted on it or dismissed it.
7. Remember state across sessions
Restore filters, partially completed forms, the record being reviewed, and the last-used view. This is the least glamorous strategy here and often the highest-return, because it fixes a failure users notice immediately: starting over. It also respects strategy 4, since nothing moves; the product simply remembers.
8. Design for situations, not inferred feelings
Products often claim to respond to frustration or confusion. Behavioral data cannot reliably tell frustration from careful reading: a long pause before the first click might be either. Design responses to observable situations instead: repeated errors on the same field, a failed search with no results, a long processing wait, a completed first task. Each deserves a deliberate response (a clearer error, a fallback suggestion, a progress explanation, a moment of acknowledgment), and none requires guessing what the user feels.
Rules or models?
Most personalization discussions jump to machine learning. The decision is better made on four questions.
- Is the variable space bounded and the correct behavior known? Use rules. Onboarding branches, role-based layouts, and preference-driven defaults fall here.
- Is it too large for hand-written rules, and do you log consistent behavioral signals? A model becomes worth considering. No universal user-count threshold exists; numbers like “you need 10,000 users” are rules of thumb that vary by problem and signal quality.
- Do you understand why users behave as they do? If not, a model trained on that behavior will scale the confusion. Research first.
- Can you explain the output to the user in a sentence? If not, you will struggle to give them control over it (see the next sections).
A common and sensible pattern is hybrid: a model proposes, and rules constrain what can be shown (brand, legal, safety, business logic). Netflix’s artwork system works in this spirit, with a model choosing among a pool of images that people have already vetted. Start with rules, learn the failure modes, and add models where complexity justifies them.
Where personalization breaks
- Cold start. New users have no history. Use context, one onboarding question, and sensible defaults rather than cohort guesses presented as insight. Netflix lists cold start as a core challenge even for new titles.
- Stale signals. Preferences from long ago can mislead. Build decay into the logic so older signals lose weight unless reinforced.
- Feedback loops. A system that learns only from what it showed can narrow what it shows. Reserve part of the experience for exploration that sits outside the personalization logic.
- Changing the interface between sessions. Netflix itself flagged that varying artwork could help or confuse. Test whether adapting a given element is perceived as relevance or as instability.
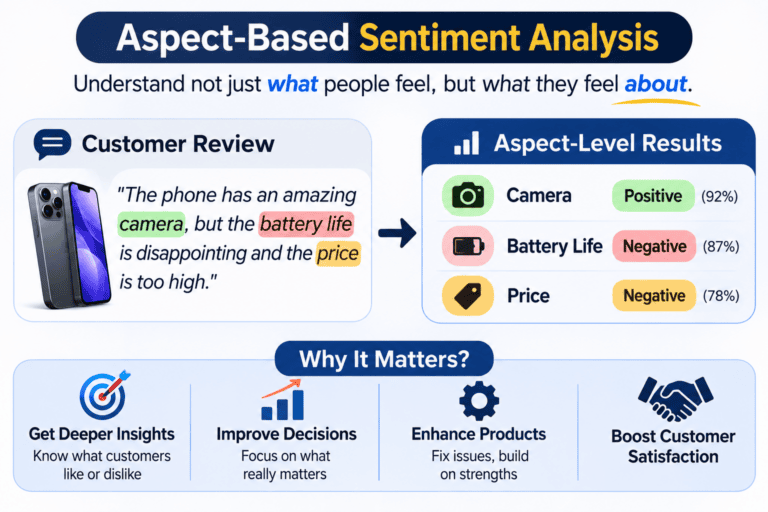
- Ambiguous inference. Hesitation, abandonment, and rapid scrolling each have several possible causes. Prefer decisions that stay safe if the inference is wrong.
- Shared devices and accounts. One login may represent several people. Personalization built on a blended profile serves nobody well, so offer profiles or a quick reset.
Privacy, consent and the control surface
The same data can feel attentive or invasive depending on how it is used, explained, and controlled. Epsilon’s survey found a quarter of respondents calling personalized offers creepy, and Twilio’s 2025 survey found most consumers want to adjust their own settings. Controls are part of the product, not a legal footnote.
Four design practices follow from this:
- Explain the exchange. Say what you remember and what the user gets for it, in the interface, at the moment it applies: “We’ll remember your layout across sessions.”
- Make controls reachable. Provide a “why am I seeing this?” explanation and a way to change or switch off the adaptation, near the element it affects.
- Let signals expire. Decay older data and offer a reset.
- Keep it explainable. If the team cannot state in plain language why a user sees something, the user cannot be given meaningful control over it.
What EU law now asks of recommender interfaces
If your product operates as an online platform in the EU, the Digital Services Act has specific rules. Article 27 requires online platforms to describe the main parameters of their recommender systems in plain and intelligible language. Article 38 requires very large online platforms and search engines to offer at least one recommender option not based on profiling, as defined in Article 4(4) of the GDPR. Recital 94 says such choices should be directly accessible from the interface where recommendations appear.
Most products are not very large online platforms, and scope depends on the service, so check with counsel before assuming either way. The design pattern (a visible, one-step switch to a non-profiled view) is worth borrowing regardless. This section is general information, not legal advice.
Tools by maturity stage
The usual mistake is buying advanced tooling before the data foundation exists. A recommendation engine needs clean, consistent event data. If tracking is messy, fix that first.
| Category | Examples | Use it for | Stage |
|---|---|---|---|
| Behavioral analytics | Mixpanel, Amplitude, PostHog | The signal foundation everything else depends on | Foundational |
| Experimentation | Optimizely, VWO, Statsig, GrowthBook | Testing each personalization hypothesis against a control | Foundational |
| Feature flags | LaunchDarkly, Flagsmith, GrowthBook | Segment rollouts and fast kill-switches | Foundational |
| Customer data platforms | Segment (now part of Twilio), RudderStack, mParticle | Unifying profiles across surfaces | Intermediate |
| In-app guidance | Pendo, Appcues, UserGuiding | Targeted tooltips and announcements without engineering time | Intermediate |
| Managed recommendation services | AWS Personalize, Google Cloud’s commerce recommendation products | Recommendations at scale once rules hit their ceiling | Advanced |
| Real-time decisioning | Braze, or custom event-driven stacks | In-session responses to live behavior | Advanced |
Examples are illustrative, not endorsements, and were not tested for this guide. Vendor names and product lines change, so confirm current offerings.
Measuring what matters
Engagement metrics mislead here. Clicks on recommendations rise when you show more items, and time on site rises when users are confused. Start with the metric that answers the real question.
Keep a global holdout. Reserve a small group that receives no personalization and compare outcomes against it over a period long enough to capture repeat behavior. This is the only way to separate the effect of personalization from everything else changing in your product.
| Metric | What it tells you | How to read it | Common trap |
|---|---|---|---|
| Lift vs. holdout | Incremental value of the personalization | Compare activation, retention, or revenue per user against the holdout | Holdout too small or too short |
| Time to key action | Whether friction is falling where it matters | Compare personalized cohorts against control | Measuring any speedup, not the use-case-relevant one |
| Override rate | How often users change a personalized default | Track by segment over time. Near zero can mean accurate defaults or hidden controls; high means wrong assumptions | Treating one number as a universal benchmark. None exists |
| Return rate by cohort | Whether value persists past novelty | Personalized vs. holdout over weeks | Reading an early spike as lasting value |
| Signal staleness | Whether relevance decays | Compare acceptance of items driven by old vs. fresh signals | Never checking |
| Qualitative resonance | Whether users notice the adaptation | Ask in interviews: “When did the product feel like it adapted to you?” | Leading questions |
Pair these with guardrail metrics: opt-outs, personalization-off rates, support contacts about “why am I seeing this”, and complaints.
FAQ
What is personalized UX design?
It is the practice of adapting an interface’s content, structure, or behavior to an individual user based on stated preferences, observed behavior, or context, so that different users get meaningfully different experiences from the same product.
What is the difference between personalization and customization?
Customization is user-driven: the person changes settings or layouts themselves. Personalization is system-driven: the product adapts based on what it knows. Good products offer both and let explicit customization override automated personalization.
Do I need machine learning to personalize UX?
No. Many high-value changes are rule-based: role-specific onboarding, remembered preferences, restored state, and contextual copy. Consider models when the variable space outgrows rules and you have consistent behavioral data.
How do you personalize for new users with no data?
Use context (device, referral source), ask one onboarding question that most affects their needs, and offer sensible defaults. Treat cohort inference as a temporary fallback and drop it as the user generates their own signals.
How do you measure whether personalization works?
Keep a no-personalization holdout and compare activation, retention, and revenue per user against it. Add override rate, time to key action, and qualitative interviews as diagnostics.
Is personalized UX a privacy risk?
It can be. Surveys by Epsilon and Twilio show a meaningful share of consumers find personalization intrusive or want more control. Explain what you remember, give visible controls, let signals expire, and check which regulations apply to you.
What is the biggest mistake teams make?
Adapting the structure of the interface (moving navigation, reordering menus) from weak signals, when adapting content and emphasis inside a stable frame would be safer and easier to explain.
Takeaways by role
- Founders and product managers: Pick the one fork in your user journey that matters most (role, goal, or experience) and build two onboarding flows. Test against a single-flow control. No model required.
- Designers inheriting a product: Run a handful of interviews asking when the product felt like it adapted to the person. If nobody can name a moment, audit what you collect against what you act on.
- Engineers: For each new data source, write down the question it answers, the decision it changes, and the fallback if the signal is wrong. Keep personalization behind flags so it can be switched off per user and globally.
- Product leaders: Ask for lift against a holdout, not engagement alone, and add override rate by segment to the review.
Sources and evidence grades
🟢 primary source read or primary text confirmed · 🟡 confirmed through credible secondary coverage · 🟠 first-party or vendor-reported · 🔵 editorial judgment
| Claim in this guide | Source | Grade |
|---|---|---|
| 71% expect personalization, 76% frustrated, survey details | McKinsey, The value of getting personalization right, or wrong, is multiplying (Nov 2021) | 🟢 |
| Faster-growing companies derive 40% more revenue from personalization | Same McKinsey report | 🟢 |
| 80% more likely to do business; 1,000 consumers; 2017 survey | Epsilon press release (Jan 2018) | 🟠 |
| 25% “creepy”, 32% not worth the privacy cost | Summary of the Epsilon study | 🟡 |
| Twilio 2025 sample size and field dates | Twilio State of Customer Engagement report | 🟠 |
| 84% want to adjust settings; 15% “absolutely” trust brands with data | Twilio report page; Chain Store Age summary | 🟠 / 🟡 |
| Progressive disclosure: benefits, two-level limit | Nielsen Norman Group | 🟢 |
| Adaptive menus break spatial memory | Jakob Nielsen’s later write-up | 🟡 |
| Netflix artwork personalization, contextual bandits, cold start, session-change question | Netflix Technology Blog (Dec 2017); RecSys 2018 talk abstract | 🟡 |
| Duolingo: fixed course structure, Birdbrain exercise selection, A/B results, over 20% of lessons | Duolingo blog: Birdbrain; Duolingo blog: how experts work with AI | 🟠 |
| DSA Article 38 text; Recital 94 | Regulation (EU) 2022/2065, Art. 38 | 🟢 |
| DSA Article 27 summary | Mozilla Foundation analysis | 🟡 |
| Signal ranking, four-type taxonomy, rules-vs-models questions, tooling stages | Editorial judgment | 🔵 |
Limits: the McKinsey figures are from 2021 and the Epsilon figures from 2017. They remain the most widely cited baselines, but treat them as directional. This guide contains no original research, and the tools in the table were not tested.