
Predictive Lead Scoring:
What Your Model Is Actually Learning
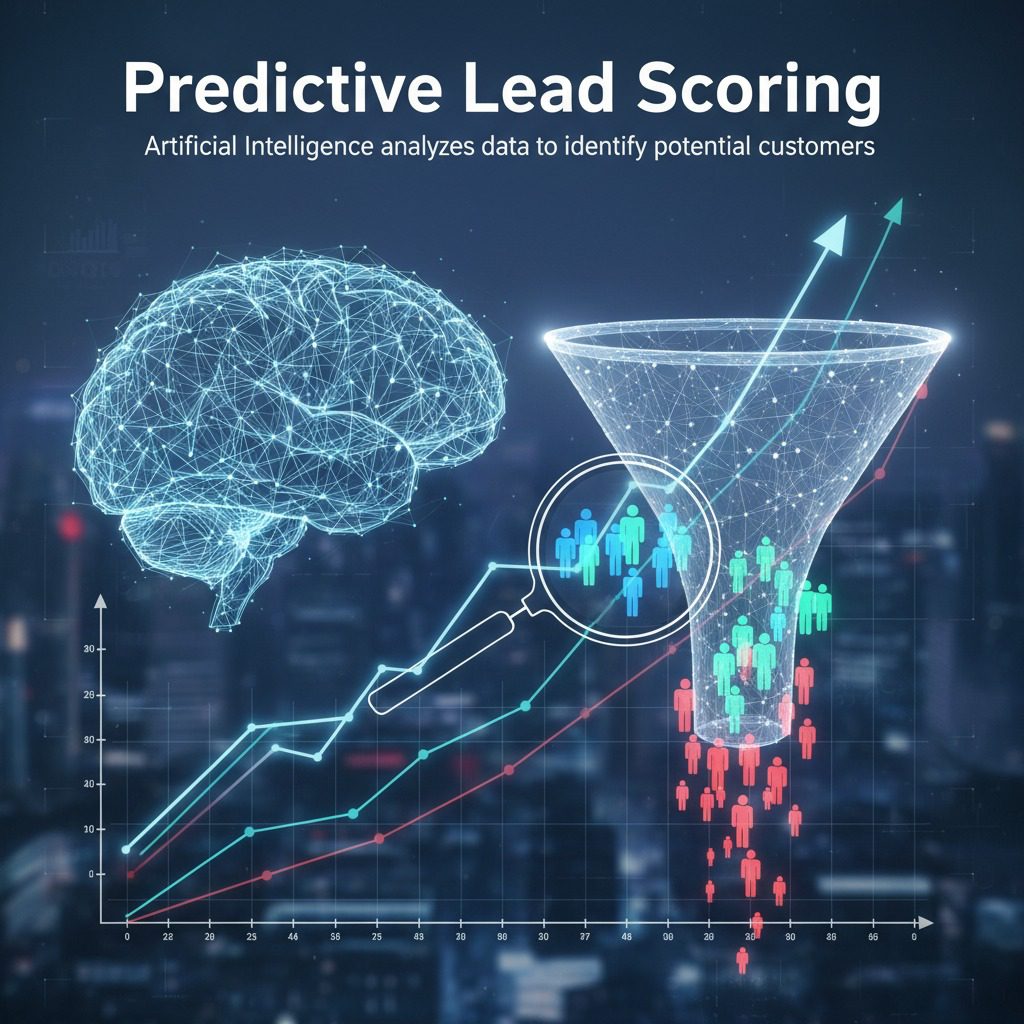
ML has made scoring faster and more accurate — but most implementations train models on the wrong thing. The fix requires understanding what your data actually measures before you build anything.
Only 27% of leads marketing sends to sales are genuinely qualified for sales engagement. [LLCBuddy, 2025 — secondary aggregation; directional] That gap costs B2B companies in both directions: reps burn cycles on low-probability prospects while high-fit buyers who engaged quietly go uncontacted until someone else closes them.
Predictive lead scoring was built to close that gap. But the technology carries its own trap, and most implementations walk straight into it.
The trap is selection bias. A model trained on leads your sales team previously chose to pursue doesn’t learn which prospects are inherently valuable — it learns which types of prospects your reps paid attention to. Those are different problems. Conflating them can make a company systematically invisible to its own best growth segments while appearing to optimize.
There’s a second, more structural problem hidden in the performance data. It only becomes visible when you notice which funnel stage each claim actually measures. More on that in a minute.
These three metrics measure different funnel stages and use different model architectures. They are not interchangeable. The 38% figure measures lead-to-opportunity conversion. The +32pt figure measures win rate at the closed-won stage. A vendor who presents both in the same benchmark slide is telling you something about their rigor.
What Predictive Scoring Measures — and Where the Claims Come From
Traditional lead scoring assigns fixed points to observable attributes: a VP title earns fifteen points, a pricing-page visit earns ten, a student email domain loses five. Intuitive. Fast to set up. And the results directly reflect the assumptions of whoever built the rubric. When the ICP shifts — as it does when markets mature or positioning changes — the rubric requires manual recalibration that rarely happens on schedule.
Predictive scoring replaces the fixed rubric with a statistical model trained on historical closed-won and closed-lost data. The model identifies which combinations of signals correlate with conversion — the interactions invisible to rule-based systems, where “VP title at a 50–250 person SaaS company that visited the pricing page twice” converts at a fundamentally different rate than any single attribute would predict.
“A model trained on your closed-won data doesn’t learn which prospects are valuable. It learns which prospects your reps paid attention to. Those are different problems.”
Editorial synthesis — sources: Hackrlife Newsletter (Aug 2025), Gencomm AI (Jun 2025), Wu et al. (2023)
A February 2025 study published in Frontiers in Artificial Intelligence compared fifteen classification algorithms — Gradient Boosting Classifier, XGBoost, Random Forest, Logistic Regression, SVM, and others — applied to CRM data from a single B2B SME in the software/manufacturing sector. The Gradient Boosting Classifier achieved the highest predictive accuracy across all models. [Sample: single company, one industry vertical. Generalizability across company sizes or ICP structures cannot be assumed.]
The Gradient Boosting finding is credible and consistent with the broader ML literature on classification problems with non-linear feature interactions. That structure is exactly what B2B conversion data looks like. But “consistent with the literature” is different from “universally true across B2B contexts.” A direction the evidence supports — not an established universal.
CRM-based ML models (trained on your historical data) report performance improvements predominantly at the lead-to-opportunity stage — the model gets better at predicting which leads sales will open a deal on. Intent platforms like 6sense report improvements predominantly at the win rate / closed-won stage. These are not comparable metrics measuring the same thing. CRM-based models solve prioritization within known leads. Intent platforms solve identification of anonymous in-market accounts. The 38% lead-to-opp improvement from Brixon Group’s Forrester citation and the 32-point win rate jump from Asana’s 6sense deployment address different problems in the pipeline. Both real. Neither tells you what the other does.
When evaluating vendor benchmarks, ask: which funnel stage does this improvement measure, and what was the comparison baseline? A vendor who can’t answer that question in one sentence is not a vendor who has thought carefully about their evidence.
Related: AI personalization in B2B| Dimension | Traditional (Rule-Based) | Predictive (ML) | ⚠ Adversarial column |
|---|---|---|---|
| Setup speed | Days to weeks | 3–6 months typical | ML requires ≥1,000 closed-won records for reliable training. Below that threshold, rule-based outperforms — and most teams building their first model don’t have 1,000 clean records. |
| ICP adaptability | Manual only — lags reality | Continuous, if retrained quarterly | “Continuous learning” is marketing language. Retraining requires scheduled effort and clean feedback data. Vendors who don’t surface a retraining cadence in their contract are selling you a static model wearing dynamic clothing. |
| Selection bias risk | Moderate — bias is visible in the rules | High if unaudited — bias is implicit | Explicit rule-based bias is at least diagnosable. ML bias looks like correct model behavior until a segment-level pipeline audit says otherwise. You won’t notice it from aggregate accuracy metrics. |
| Non-linear signal detection | None — each rule is independent | Native — Gradient Boosting excels here | Non-linear detection is genuinely powerful. But it also means the model can learn spurious correlations — signals that predicted conversion historically because of a market condition that no longer exists. |
| Explainability to reps | High — reps see the rules | Low without feature importance tooling | Sales rep trust collapses when scores can’t be explained. If your platform can’t show a rep, in their CRM workflow, why a specific account scored 87, adoption risk is high regardless of model accuracy. |
| Data quality dependency | Tolerates sparse CRM data | Accuracy degrades ≈27% with missing firmographic fields | “Data quality” is the answer every vendor gives when an implementation fails. That doesn’t make it wrong. [Brixon Group, 2025 — secondary source; original Forrester not independently verified] |
The Selection Bias Problem Most Implementations Ignore
Your historical closed-won and closed-lost data do not represent the market. They represent the subset of leads your sales team previously chose to pursue — and those two populations can diverge substantially over even 18 months of ICP evolution.
The algorithm learns that certain characteristics predict conversion without understanding that those characteristics actually predict sales attention, not inherent prospect value. The model looks accurate on historical validation data. In production, it quietly deprioritizes your growth segments because they look different from the deals you closed back when your ICP was different.
A model producing selection-biased scores presents those scores identically to unbiased outputs — same confidence percentages, same dashboard formatting, same apparent precision. There is no warning light. The growth segments it deprioritizes will never surface as anomalies in your pipeline reporting. They’ll just not close, and someone will attribute it to poor fit. You don’t see the problem from the model. You only see it from a segment-level pipeline audit against actual conversion outcomes — which almost nobody runs before concluding the model is working.
Selection bias compounds with a second technical problem: training on the “latest CRM snapshot” rather than the data available at the actual scoring decision point. See also: AI data pipelines Gencomm AI’s June 2025 analysis identifies three failure modes from this:
- Information leakage: training features include data collected after the decision point, inflating held-out accuracy in ways that evaporate in production
- Feature distribution bias: day-30 engagement metrics look different from day-0 data the model will actually use when scoring new leads
- The implicit feature problem: a model infers “customer lifetime” from combined timestamp fields, then penalizes new leads simply for being new
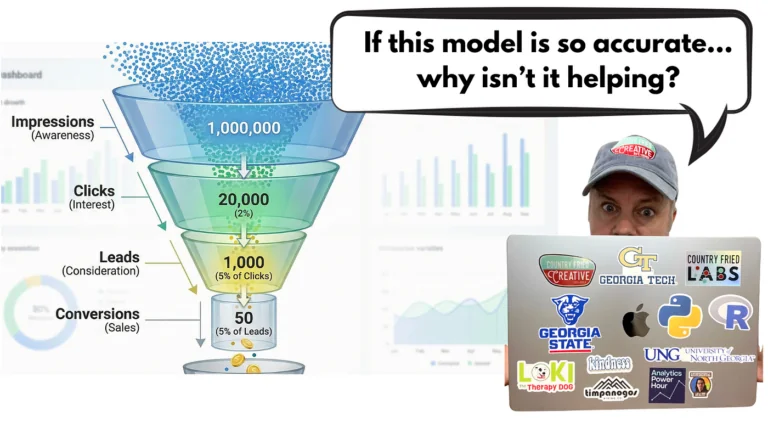
The Funnel That ML Actually Trains On
“The model trains on a fraction of a fraction. It gets very good at predicting that fraction. Whether that fraction represents your best growth opportunity is a different question entirely.”
Editorial synthesis — sources: Hackrlife Newsletter (Aug 2025), Wu et al. (2023), Gencomm AI (Jun 2025)
The Failure Mode Vendors Don’t Put in Their Case Studies
The failure mode isn’t always a biased model that produces wrong scores. Sometimes the failure is organizational: a scoring system that never gets used. Harder to diagnose. More common than vendors acknowledge.
Rithum — a B2B commerce technology company — acquired 6sense and then allowed the platform to sit largely unused for nearly two years. When a newly formed growth marketing team took ownership in early 2025, they discovered they’d been paying for intent and scoring infrastructure without building the workflows to act on it. Zero scored leads were being routed differently than unscored leads. The model was running. Nobody was listening to it.
Within one quarter of reactivating the platform — rebuilding segments, integrating scoring into SDR workflows, establishing 6QA thresholds — 6sense reported at their November 2025 Breakthrough Conference that 6QA-influenced opportunities made up 58% of Rithum’s Q2 pipeline. [Disclosure: 6sense’s own conference presentation about their own customer. No independent audit of this metric exists.]
The two dormant years weren’t just wasted subscription spend. They were two years during which leads were prioritized by manual judgment, outbound lists, or no system at all — while the team nominally had predictive infrastructure. That misalignment between having a tool and using it is recoverable. The diagnostic question: “What percentage of our scored leads are actually touched differently than unscored leads?” should be asked before and after any deployment. Most teams never ask it.
Three Structural Decisions That Determine Whether Your Model Works
1. Define the conversion label before you build
The label is the most consequential decision in the entire process. “Lead-to-opportunity” is the most common choice because the data is available and the feedback loop is short. But a model optimized for opportunity creation can diverge from revenue optimization: it may learn to score leads that are easy to get on a discovery call rather than leads likely to close.
If your sales team measures itself on pipeline generation, this produces a model that fills the funnel with deals that stall. Define the label against the outcome you actually care about — closed-won revenue — and accept that you’ll need a longer observation window and more data to get there.
2. Audit training data for segment coverage before modeling
Run a segment-level distribution analysis on your closed-won records before any model is built. Break it down by company size, industry, and buyer persona. If one segment represents 80% of historical wins, the model will reflect that distribution.
Leads from underrepresented segments will score low, not because they’re poor prospects but because the training data never saw them close. This is not a problem the algorithm fixes — it’s a problem you fix by enriching the training data, or by building separate models for segments with materially different conversion dynamics.
3. Track model drift every quarter
A model trained on 2023 data and deployed unchanged into 2025 is running on a stale map. Concept drift — where the relationship between input signals and conversion outcomes shifts as market conditions, buyer behavior, or competitive dynamics change — is not a hypothetical risk. It’s scheduled maintenance you haven’t done yet.
The specific pattern documented in ML bias research: a B2B software company that historically closed through IT Directors finds the model still prioritizing that persona two years after purchasing decisions migrated to business unit leaders. Quarterly model performance tracking against live closed-won data is the minimum detection frequency. [Hackrlife Newsletter, Aug 2025]
| Failure mode | How it manifests | Detection method | ⚠ What resolution actually requires |
|---|---|---|---|
| Selection bias | Model underscores growth segments that look different from historical wins | Segment-level pipeline conversion rate vs. model score percentile | Segment audit + retraining with expanded labels. Requires someone with authority to say “our historical win data is not representative of our target market.” That’s a political problem, not a technical one. |
| Information leakage | High test accuracy; poor live performance on new leads | AUC on hold-out set vs. actual conversion after 90-day window | Rebuild training pipeline using point-in-time snapshots. Requires rearchitecting how CRM data is extracted for training — not a config change. |
| Concept drift | Score quality degrades gradually; pipeline looks stable but win rates are declining | Quarterly model tracking against live closed-won data | Ongoing. Requires scheduled retraining every 3–6 months minimum. No platform automates this correctly without a human reviewing what the retrained model learned. |
| Class imbalance | Model predicts “will not convert” for nearly everything — technically accurate if 95% of leads don’t close | Check precision and recall separately; high accuracy with low recall signals the problem | Oversampling, undersampling, or cost-sensitive learning. Standard practice in ML — but you need someone who knows to check recall, not just accuracy. |
| Non-use / workflow gap | Tool deployed; reps prioritize via manual judgment instead of scores | “What % of scored leads are touched differently than unscored leads?” | No technical fix. The scoring model is irrelevant if reps don’t use it. Requires operational change management — often the part vendors don’t help with. |
What a Drift-Aware Monitoring Setup Looks Like
| Lead / Company | Pred. Score | Segment | Stage | Actual Conv. Rate | Delta vs Expected | Last Activity |
|---|---|---|---|---|---|---|
| Sarah Chen · TechNova | 92% ↑ | High Intent ICP | SQL | 41% (n=180+) | -3% (mild drift) | Pricing page ×3 today |
| Michael Reyes · CloudPeak | 87% | High Intent ICP | Opportunity | 38% | +2% outperforming | Demo booked |
| Priya Patel · DataForge | 76% ↓ | Mid-Market Warm | MQL | 22% | -8% (drift alert) | Webinar, no follow-up |
| Elena Vargas · ScaleUp | 65% | Mid-Market Warm | MQL | 18% | -5% (segment underperf.) | Multiple sessions >10min |
| Raj Singh · FutureGrid | 59% ↓ | Low-Fit Cold | Lead | 9% | +4% unexpected lift | Pricing view only |
| Fatima Khan · Pulse Tech | 55% | Low-Fit Cold | Lead | 8% | +2% | Site visit: careers page ⚠ |
The careers-page visit on Fatima Khan’s record is a good example of the noise problem. High engagement. Completely wrong signal. Rule-based systems catch that with an explicit exclusion. ML systems may or may not, depending on whether similar patterns appeared in training data with low conversion outcomes.
See also: RevOps AI tooling guideWhere This Market Is Heading
Two converging patterns are reshaping what scoring looks like in practice. Both carry implications for the build-vs-buy decision most mid-market teams are navigating right now.
The first is dark funnel integration. 6sense’s 2025 B2B Buyer Experience Report — based on responses from 4,000+ B2B buyers — found that buying cycles shortened from an average of 11 months in 2024 to 10 months in 2025, while 94% of buying groups ranked their preferred vendor before first contact with sales. Those buyers weren’t in any CRM. CRM-based ML scoring, trained on known leads, cannot score accounts in the dark funnel.
Intent platforms exist precisely to bridge that gap — but they solve a different problem than lead prioritization, and the performance metrics they report reflect that difference. The correct framing for most RevOps teams isn’t “which platform’s scoring is more accurate?” It’s “what percentage of our pipeline lives in the dark funnel vs. the CRM, and do we need both solutions?”
The second is explainability as an adoption requirement. A consistent finding across 2025 practitioner discussions: scoring models with opaque logic fail on adoption. Reps ignore scores they can’t interpret, regardless of model accuracy. A 70% accurate model that every rep acts on outperforms a 90% accurate model that gets ignored. That’s not speculation. It’s the Rithum case, written out.
The technical accuracy of a scoring model is not the primary determinant of pipeline impact. The primary determinants are: (1) whether the training data represents your actual target market rather than your historical sales attention, (2) whether score outputs connect to daily rep behavior, and (3) whether retraining cadence matches the rate of ICP evolution. A team that gets all three right with a mediocre algorithm will outperform a team with a sophisticated algorithm and one of these wrong.
Before You Sign Anything: Who This Looks Like For Your Role
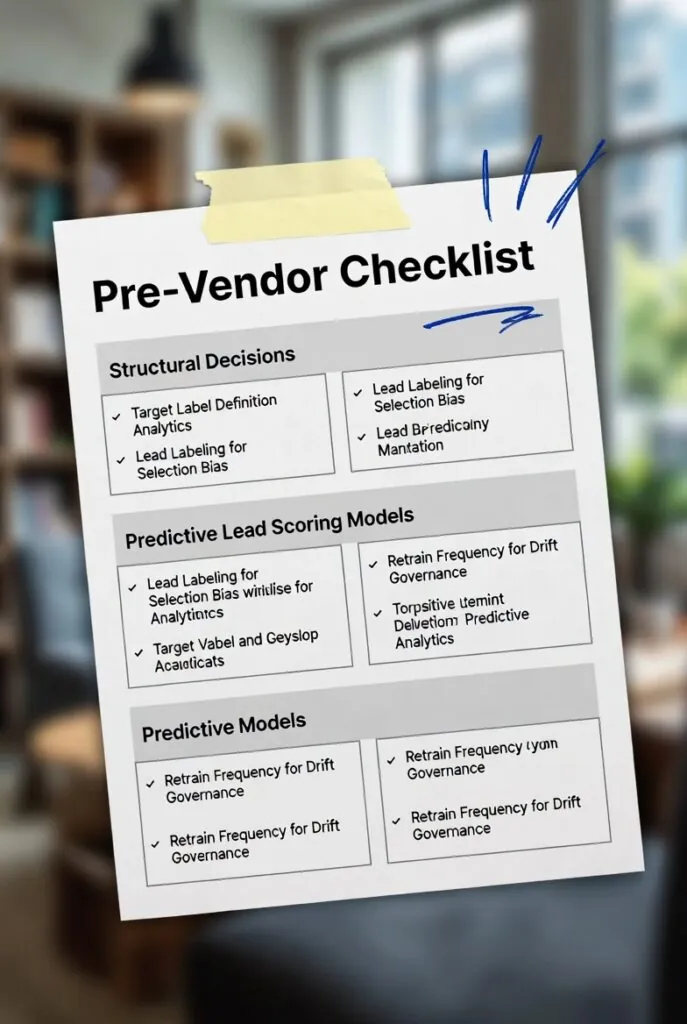
The four questions to ask every vendor, in this order
Look, here’s what this actually is: a procurement problem before it’s a technology problem. The scoring algorithm matters less than whether the vendor’s evidence applies to your funnel stage, your data maturity, and your rep workflow. Most vendor decks conflate these. Your job is to disaggregate them.
- What funnel stage does your benchmark measure? Lead-to-opportunity, SQL-to-close, or win rate — make them specify. A vendor who conflates these is telling you something about their rigor.
- How is feature importance surfaced to reps? Ask for a screenshot of how a sales rep sees why a specific account scored 87. If the answer is “that’s in the analytics dashboard” rather than “in their CRM workflow,” adoption risk is high.
- What is your retraining cadence, and who triggers it? A platform with no scheduled retraining and no drift-detection mechanism is selling you a static model wearing dynamic clothing.
- How do you handle accounts that have never entered our CRM? This separates CRM-based ML vendors from intent platform vendors. The answer determines which problem the tool actually solves.
Here’s what’s going to stop you: The honest answer to question 2 is almost always bad, and vendors know it. They’ll redirect to the analytics dashboard. Push back. If explainability doesn’t live in the CRM workflow, it doesn’t exist for your reps.
Stop doing this: Don’t evaluate lead scoring platforms by comparing their benchmark metrics to each other. The benchmarks measure different things. Compare them by which funnel stage each solves, then decide which stage is your actual bottleneck.
The lead quality problem is upstream of the scoring problem
Here’s the reframe: predictive lead scoring is not a fix for a lead generation strategy that’s producing the wrong leads at volume. If 73% of your leads are genuinely unqualified for sales engagement, a scoring model will correctly identify them as low-probability — but you’re still paying to generate them. The scoring problem and the lead quality problem are different problems.
What’s specific to your planning cycle that doesn’t appear in the main analysis: if you’re rebuilding first-party data collection alongside a scoring implementation, expect a 12–18 month gap before model quality reflects the cleaner data. Annual budgeting cycles will produce two planning rounds during which the model is running on partially degraded signals. That’s a reality to plan around, not an edge case to dismiss.
Here’s what’s going to stop you: The model will score against historical wins. If your historical wins came disproportionately from one channel (say, field events), the model will favor leads from that channel — regardless of whether that channel is still the best one for your current ICP. You’ll need to explicitly audit this before launch.
Stop doing this: Don’t use predictive score percentiles as a proxy for lead quality in QBR reporting without disclosing what the model was trained on. A high score means “looks like leads that converted historically.” It does not mean “high quality by current ICP standards” if the ICP has shifted since training.
The Foundational Tension
The structural tension predictive lead scoring reveals isn’t between old methods and new ones. It’s between models that learn from your sales team’s historical attention and models that reflect actual buyer behavior — and closing that gap requires decisions before the first line of training code runs.
Organizations that deploy ML scoring on top of existing CRM data without auditing the training set for segment coverage will replicate whatever biases already shaped their pipeline. The model will appear to work. The growth segments it deprioritizes will never surface as anomalies. They’ll just not close.
The decision framework is straightforward: if ICP stability is high and closed-won data is rich (≥1,000 records), the case for ML is strong. If the company is actively expanding into new segments, run the segment coverage audit first and consider separate models per segment. If closed-won data is below threshold, a well-designed rule-based system with quarterly human review outperforms an underfit ML model. Every time.
“The technical question of which algorithm to train is downstream of the operational question of how score outputs connect to daily rep behavior.”
Editorial synthesis — sources: Appvizer (2025), 6sense Breakthrough Conference (Nov 2025), Rithum case
A model that knows the truth about your pipeline is useless if nobody’s listening to it.
Citations & Attribution
- Frontiers in Artificial Intelligence (February 2025) — “The relevance of lead prioritization: a B2B lead scoring model based on machine learning.” Single B2B SME, 15 algorithms compared, Gradient Boosting Classifier highest accuracy. [Directly accessed. Single company, one industry vertical. Generalizability cannot be assumed.]
- Brixon Group (May 2025) — “Predictive Lead Scoring with AI: Setup, ROI and Avoiding Costly Pitfalls,” citing Forrester “AI in B2B Sales 2024.” [Secondary source attribution. 38%/28%/27%/43% figures accessed from Brixon Group only; original Forrester reports not independently verified.]
- Wu et al. (2023) — Information Technology and Management, systematic review of 44 lead scoring studies (2005–2022). [Directly accessed via Springer.]
- Gencomm AI (June 2025) — “The Biggest Mistake in Lead Scoring.” [Directly accessed.]
- Hackrlife Newsletter (August 2025) — “The Lead Scoring Trap: When Predictive Models Predict the Wrong Thing.” [Directly accessed.]
- 6sense 2025 B2B Buyer Experience Report — 4,000+ buyers. [Directly accessed.]
- 6sense Breakthrough Conference (November 2025) — Rithum and Asana customer award results. [Platform self-reported; no independent audit. Rithum use confirmed across multiple published 6sense sources.]
- Appvizer (2025) — Predictive Lead Scoring platform evaluation. [Directly accessed.]
- LLCBuddy (2025) — lead qualification statistics analysis. [Secondary aggregation; used for directional figure only. 27% MQL qualified figure not independently verified.]
Contact Us
How Predictive AI in CRM Boosts Sales by 300%: Revolutionizing Customer Relationships
The Future of CRM Automation: 10 Game-Changing AI Tools Every Business Needs in 2025
Top 8 Generative AI CRM Strategies for Smarter Selling