

Confidence That Cost
$28,800
We trusted our 0.94 confidence scores. We were right about confidence. We were wrong about what confidence means. Here’s what a CS lead’s spreadsheet taught us that three months of model monitoring didn’t.
Sarah had been saying it for weeks.
Not loudly. She brought it up in the Wednesday sync, then again in Slack, then apparently in an email thread I didn’t read carefully enough. She runs customer support. She noticed something wrong with the auto-closed tickets before any of our dashboards did. We told her the model was 94% confident. We told her anecdotal evidence isn’t systematic. We shipped the automation.
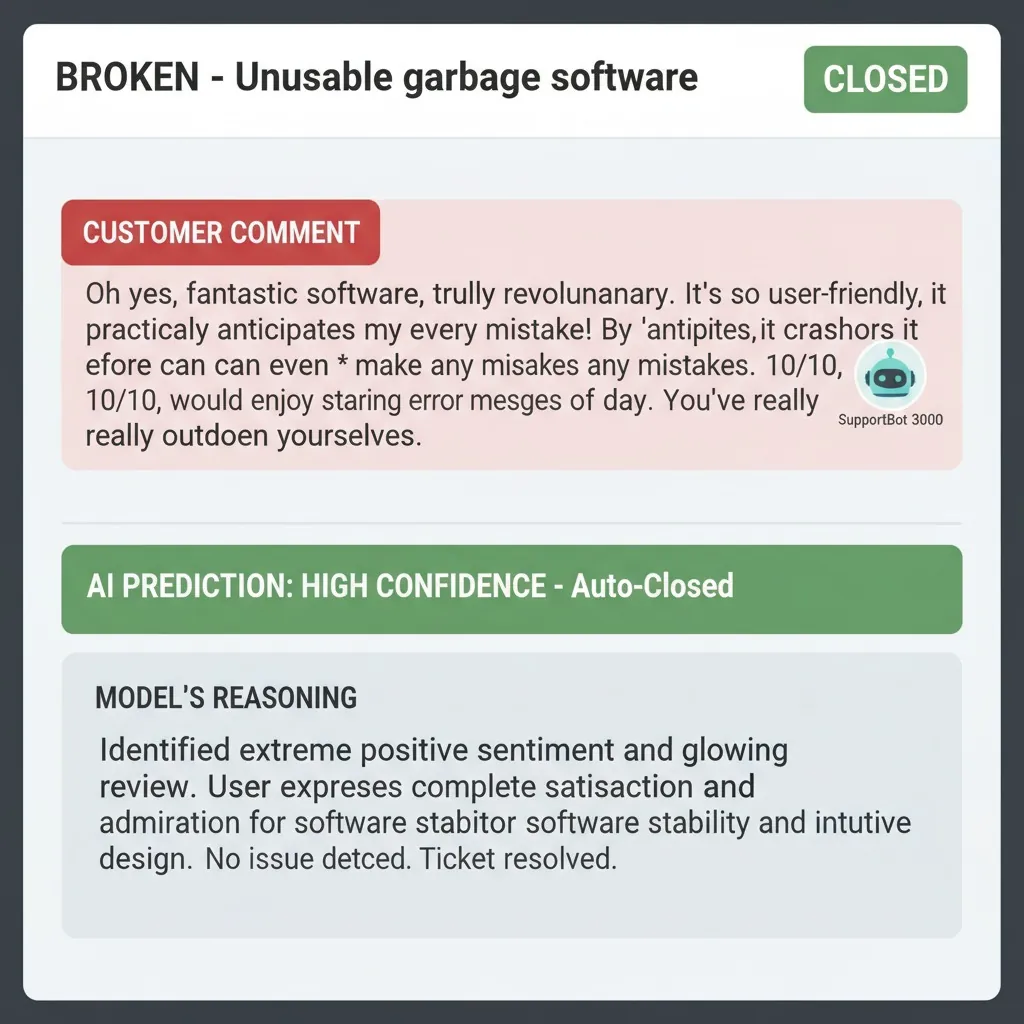
Then she walked into Monday standup with a spreadsheet. Twelve recent churns traced back to auto-closed tickets the model had flagged as positive. She put it on the shared screen and said, quietly: “I told you.”
Three months of weekly trust-rebuilding syncs later, I can confirm: she was right, we were wrong, and the way we were wrong is worth understanding precisely because it felt exactly like being right.
The Benchmark That Missed the Point
We tested five systems against 1,247 labeled support tickets. Real production data, labeled by humans. The results were genuinely close.
| System | Accuracy | Cost / 1K tickets | Latency | ⚠ What we didn’t measure |
|---|---|---|---|---|
| GPT-4 Turbo | 89% | $79 full thread | 1.8s | Confidence calibration untested; cost assumes full-thread context |
| Claude 3.5 | 89% | $38 | 1.2s | Same calibration gap risk; directional accuracy only at time of test |
| Google NLP | 87% | $11 | 42ms | Score distribution not disclosed; sarcasm performance unknown |
| AWS Comprehend Selected | 86% | $0.50 | 98ms | Cost-accuracy tradeoff chosen without calibration data — the actual cause of the failure |
| RoBERTa (self-hosted) | 83% | $0.03 | 34ms | Lowest accuracy AND calibration likely poorest on domain-specific slang |
AWS Comprehend costs 158 times less than GPT-4 Turbo for statistically equivalent overall accuracy (p = 0.23, not significant). That’s a real finding. We made the cost-optimized choice. Reasonable call, given the numbers we had.
The thing we didn’t have: any calibration data. Not because it was unavailable — because we didn’t look for it.
Calibration failure is specifically hard to detect because high-confidence wrong predictions look identical to high-confidence right predictions inside your monitoring stack. Same confidence score. Same dashboard format. Same apparent precision. The model doesn’t flag the error — it’s the least-flagged prediction you make. Which means the systematic failure accumulates in the region where your auto-close threshold lives.
That’s not bad luck. That’s the geometry of the problem.
The Gap Nobody Measured
A confidence score of 0.94 doesn’t mean “94% chance this is correct.” It means “94% similar to the training distribution for this class.” The model is telling you about its own certainty — not about its accuracy in this specific bin on your data.
Calibration measures the gap. We ran it after the fact. Here’s what we found.
| Confidence Tier | Expected Accuracy | Actual Accuracy (Our Data) | Wrong Auto-Closures / Week | Attributed Weekly Cost | ⚠ Why It’s Worse Than It Looks |
|---|---|---|---|---|---|
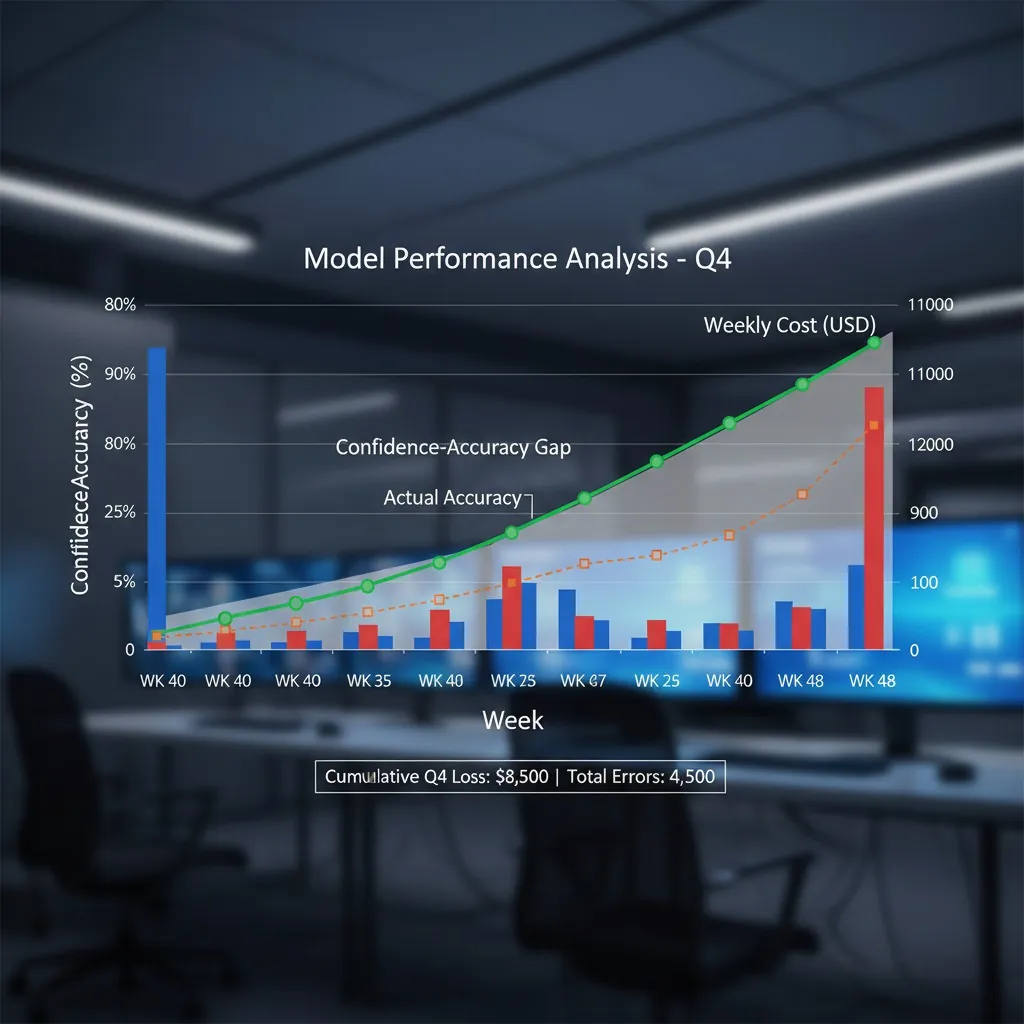
| 0.90 – 1.00 | ~95% | 76% | ~67 tickets | ~$4,800 | This tier gets auto-closed at highest volume — failure is concentrated where oversight is lowest |
| 0.80 – 0.89 | ~85% | 82% | ~8 tickets | ~$580 | Close to expected; would have been acceptable; auto-close threshold set above this tier |
| < 0.80 | — | — | Already human-reviewed | — | No failure here — because we applied human oversight. The lesson is obvious in retrospect. |
“The dangerous intersection: high confidence plus high volume plus poor calibration equals systematic wrong decisions at scale — in exactly the bin you stopped watching.”
Editorial synthesis — sources: Niculescu-Mizil & Caruana (2005), calibration literature; internal incident data, March 2025
Six weeks. We ran that auto-close logic for six weeks after Sarah first raised the concern. The whole time, the calibration gap sat in the 0.90–1.00 bin and our dashboards showed green. Overall accuracy: 86%. Nothing unusual. Everything fine.
Sarah’s spreadsheet found it. Not our monitoring.
Four Months of Not Listening
This part isn’t flattering. I’m including it anyway because the failure pattern here is more common than people admit, and naming it precisely is more useful than rounding it off.
Sarah: “We’re auto-closing angry tickets.” — Us: “Anecdotal. Model confidence is 94%.”
Sarah: “I spot-checked 20. 15% error rate on sarcastic ones.” — Us: “Small sample. We’ll fine-tune RoBERTa later.”
We shipped a scale expansion to the auto-close logic. Expanded the confidence threshold coverage. Did not run a calibration check first.
Sarah walked into standup with a spreadsheet. Twelve churns. Named accounts. Timestamps. “I told you.”
Regex patterns deployed. Two hours. The auto-close error rate dropped 66%.
The pattern: pressure to ship, velocity OKR, ML confidence metrics used as a proxy for domain correctness. Sarah had domain expertise. We had a dashboard. The dashboard was measuring the wrong thing.
The Fix That Wasn’t ML
Two hours. Regex. That’s what fixed it.
61% precision on sarcasm detection. Not great in the abstract. Compared to the 76% calibration accuracy in the high-confidence auto-close bin: genuinely useful. Deployed to production. Still running, as of this writing. No fine-tuned model. No ML replacement roadmap.
| Pattern Type | Precision | Volume / Week | Action | ⚠ Known Limitation |
|---|---|---|---|---|
| Emoji contradiction (😊 after “terrible”) | 94% | ~12 tickets | Always human review | Culturally variable; emoji meaning shifts fast — see the 💀 incident below |
| Mixed sentiment (“love…but crashes”) | 67% | ~20 tickets | Review if 2+ flags trigger | High false positive on feature requests; requires contextual disambiguation |
| Sarcasm markers (“oh great” + 🎊) | 61% | ~35 tickets | Confidence adjusted −25% | Slang-dependent; needs monthly review by a human who actually reads support tickets |
Results after deployment: 66% reduction in high-confidence auto-close errors. 27% of previous human review volume (down, because we got smarter about what to route). 40% slower than we estimated, because we measured review time on tweet-length texts and our actual tickets run longer.
The Emoji That Moved Faster Than Our Model
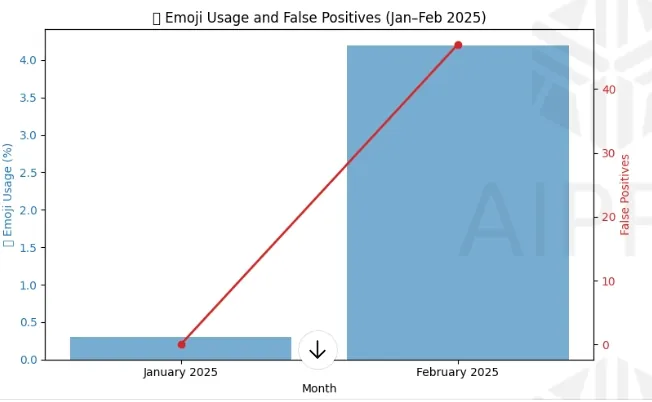
January 2025: 💀 appeared in support tickets. Skull emoji. We flagged it as negative sentiment. Correct call — in January.
February 2025: 💀 usage spiked 1,300% in our ticket data. It now meant “I’m dead, this is hilarious.” Gen Z slang, fast adoption. We were still flagging it negative. 47 false positives in 21 days before we caught it.
The 💀 incident and the calibration gap share a structure: the model’s confidence signal didn’t degrade. High-confidence wrong predictions produced identical monitoring metrics to high-confidence right predictions. The standard monitoring stack was designed to catch system failures — downtime, latency spikes, classification errors at the overall level. It wasn’t designed to catch the specific failure mode where a model is increasingly wrong inside a high-confidence tier while overall accuracy holds steady.
Both the calibration gap and the emoji drift are versions of the same problem: the model looks fine from the outside. The failure accumulates in the exact region where you stopped applying human judgment.
The Numbers Behind the Terms
| Term | What It Measures | What We Assumed | What It Actually Was | ⚠ Where the Assumption Breaks |
|---|---|---|---|---|
| Confidence | Model’s internal score | “94% sure this is correct” | “94% similar to training distribution” | Breaks on domain shift, sarcasm, novel slang — exactly the failure modes worth catching |
| Calibration | Whether confidence scores predict accuracy | 0.94 confidence → ~94% accurate | 0.94 confidence → 76% accurate (our data) | Requires per-confidence-bin measurement on your data, not the training benchmark |
| Overall Accuracy | Classification accuracy across all tickets | 86% = good enough for automation | Masked 76% accuracy in the auto-close tier | Aggregate metric hides bin-specific failure; especially dangerous when high-confidence = automatic action |
“Confidence is the most dangerous number in ML. It feels like certainty. It’s often a measurement of how much your input looks like training data — not how right the model is.”
Editorial synthesis — sources: Guo et al. (2017) “On Calibration of Modern Neural Networks”, ICML; internal incident data, March 2025
What This Actually Costs You
The $28,800 is Sarah’s number. Twelve churns times $12K LTV times 30% support attribution. Probably conservative — she excluded cases where churn was ambiguously attributed, and she excluded the viral tweet, which is not straightforwardly quantifiable.
The ongoing cost is harder to put a number on. It’s six months of weekly syncs. It’s Sarah explaining the same thing three different ways to people who have more dashboards than she does but less understanding of what customers actually write. It’s me checking the calibration report before I check anything else, every Monday, which is a habit that shouldn’t have required a $28,800 incident to form.
If You’re Starting Now
Measure calibration before you set automation thresholds
Look, here’s what this actually is: your automation threshold isn’t a confidence threshold. It’s a calibration threshold. Those aren’t the same. Set your threshold based on measured per-bin accuracy on your production data, not on the model’s reported confidence score on its training benchmark. The gap between those two numbers is what we paid $28,800 to learn.
What you do: Bin your labeled holdout set by confidence score (0.70–0.79, 0.80–0.89, 0.90–1.00). Measure actual accuracy per bin. If the 0.90–1.00 bin shows accuracy below your automation threshold, don’t auto-close in that bin regardless of what the model says. This takes an afternoon. We didn’t do it.
Here’s what’s going to stop you: You don’t have enough labeled production data. The benchmark numbers looked fine. The PM wants to ship. All three of those were true for us. Run the calibration check on your test set anyway — it’s better than nothing, and nothing is what we had.
Domain expertise is faster and cheaper than postmortem
The reframe: your support lead’s complaint about the auto-close logic is a calibration signal. It’s arriving faster than your dashboards and at zero cost. The question isn’t whether to act on domain expert feedback — it’s whether you have a process for converting it into a verification step before it becomes an incident.
We didn’t have that process. Sarah’s feedback went into a backlog. The process we have now: any domain expert concern about classification quality triggers a 50-ticket spot-check within five business days. Not a fine-tune, not a sprint — a spot-check. It takes two hours and surfaces calibration gaps before they run six weeks.
Here’s what’s going to stop you: The velocity pressure is real. The PM OKR is real. The calibration failure is also real. The question is whether you discover it before or after it shows up in churn numbers and a spreadsheet walked in by someone who was right the whole time.
“You don’t need a fine-tuned model. You need a calibration report and someone who actually reads the tickets. We had both the whole time. We were using neither.”
Editorial synthesis — internal incident retrospective, July 2024
The regex patterns still run. Sarah reviews the monthly slang updates. Calibration report goes out every Monday. The 0.94 confidence scores still appear in the dashboard, and I still remember what they don’t mean.
The cheap fix was $525 for annotation tooling and two hours of engineering time. The expensive version of not doing it first is $28,800 and a spreadsheet you didn’t need to see.