

AI Personalization ROI
A mid-sized fashion retailer really did post a headline-grabbing personalization number. Here’s what it’s counting, what a controlled test shows instead, and a simple way to tell the two apart before you repeat the claim to your own board.
- The claim is real, but it’s not what it sounds like. Bloomreach’s own marketing page says GANNI, the Danish fashion brand, saw vendor claim revenue up 60% in the first three months after migrating off Salesforce Marketing Cloud. That’s the number that inspired this whole “40% in 90 days” genre of case study.
- Trace it back further and the number changes shape. GANNI’s own implementation partner credits a established 70% increase in email-channel revenue over a full year — a different metric, a different timeframe, and a number that says nothing about total company revenue.
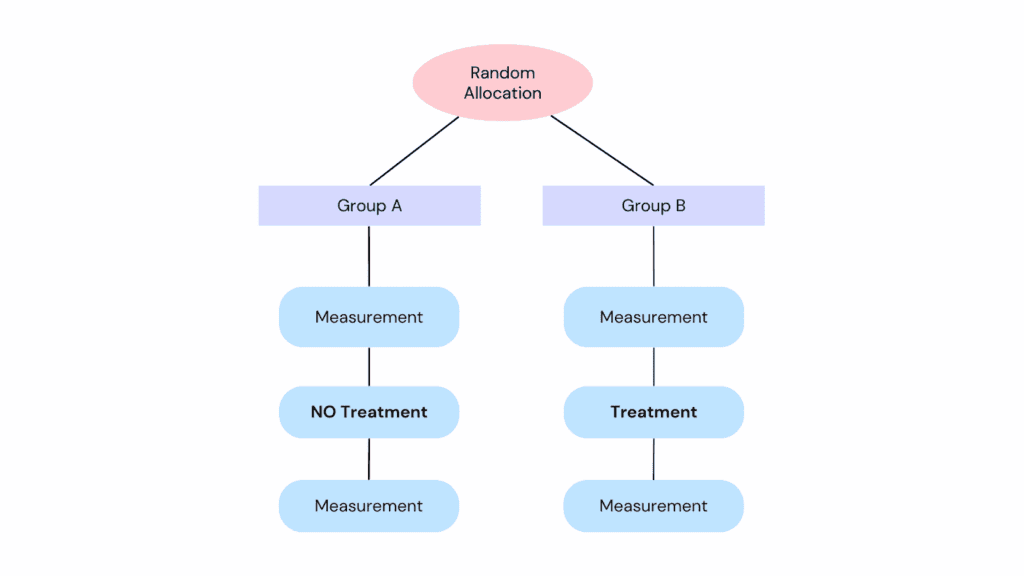
- The one personalization result I could find with an actual control group is much smaller. DFS’s Bloomreach-powered welcome series shows a controlled 3.9% revenue lift and 4.2% conversion lift against a no-personalization holdout — nowhere near 60%, and much closer to what McKinsey’s broader research has said for years.
- My take: the gap between “60%” and “under 5%” isn’t fraud, it’s selection and definition. Companies publish case studies when a channel spikes; almost nobody publishes total-revenue numbers with a control group, because most of the time the honest number is single digits. Budget for single digits, and treat anything above 15% as a claim to interrogate, not a benchmark to inherit.
I’ve pitched personalization platforms into board decks using a vendor’s homepage stat, exactly once, without reading past the headline number. A CFO in the room asked “is that email revenue or total revenue?” and I didn’t know. That’s the mistake this article is built to help you avoid — not because the 60% figure is fake, but because nobody stopped to ask what it was measuring before it became the anecdote everyone repeats.
The claim, traced to its source
GANNI is a Copenhagen-based contemporary fashion brand, owned by private equity firm L Catterton since 2017, sold through roughly 400 international retail partners plus its own concept stores and e-commerce. It’s a genuinely mid-sized company by most definitions — third-party estimates put headcount around 500 modeled, though even basic size data disagrees sharply depending on the source: business-intelligence trackers put annual revenue anywhere from roughly $20 million to the $100–500 million range, which tells you something on its own about how murky “verified” numbers get once you leave public companies.
In 2024, GANNI moved its marketing stack off Salesforce Marketing Cloud, where — according to Bloomreach’s own RFP materials — the brand had been paying an outside agency because every campaign required custom SQL work, onto Bloomreach Engagement. Three claims followed from that migration, and they are not the same claim:
| Figure | What it measures | Timeframe | Source | Confidence |
|---|---|---|---|---|
| +60% revenue | Not specified on the publishing page — likely platform/campaign-attributed revenue, not total company revenue | First 3 months post-migration | Bloomreach comparison page | vendor claim |
| +70% revenue | Email-channel revenue specifically, per Head of Digital Marketing & CRM Anders Riise Koch | One year | IMPACT Commerce case study (implementation partner) | established |
| +53% sessions | Site sessions | One year | IMPACT Commerce case study | established |
| 11% → 25% | Return-buyer rate | Not specified | Bloomreach RFP page | vendor claim |
Notice that the most-quoted number — 60% — is the least specific one. It has no named executive attached, no denominator, and no disclosure of whether “revenue” means total company revenue, revenue from campaigns Bloomreach can track, or revenue from the specific email/SMS channels the platform touches. The 70% figure, by contrast, comes with a name, a title, and an explicit scope: email campaigns. That’s a meaningfully different claim, and it’s the one I’d trust further.
None of this means GANNI is lying or Bloomreach is misrepresenting anything — case study pages are marketing copy, and marketing copy is allowed to lead with its best number. The problem is downstream: once “60% revenue” gets lifted into a listicle, then into a LinkedIn post, then into somebody’s board deck, the caveats disappear and the number becomes “what AI personalization does,” full stop. It isn’t. It’s what happened to one channel, at one brand, in one quarter, measured by the company selling the software.
The channel-to-total ladder: why 70% and 5% can both be true
Here’s the mental model I use now, and it’s genuinely simple: a channel can grow much faster than the company, because the channel usually starts from a small base. If email is 15% of GANNI’s revenue and it grows 70% while every other channel stays flat, total company revenue only grows by roughly 10.5% — not 70%. The math isn’t a secret, but almost nobody runs it before repeating the headline number.
| Assumed email/CRM share of total revenue | Reported channel lift | Implied total-revenue lift (rest of business flat) |
|---|---|---|
| 10% | +70% | ≈ +7.0% |
| 15% | +70% | ≈ +10.5% |
| 25% | +70% | ≈ +17.5% |
| 40% | +70% | ≈ +28.0% |
| 15%, adjusted for cannibalization | +70% gross, ~20% assumed cannibalized | ≈ +8.4% |
modeled The first four rows assume the rest of revenue is flat and ignore cannibalization (email sales that would have happened anyway through another channel). The last row applies an illustrative 20% cannibalization discount to the 15%-share case — a guess, not a measured figure, but a plausible one: retail attribution studies commonly find that a meaningful minority of “incremental” email or CRM revenue is actually revenue pulled forward from organic search, direct traffic, or paid channels rather than genuinely new demand. At 20% cannibalization, the +10.5% total-revenue estimate drops to roughly +8.4% — still a real result, just smaller than the uncannibalized math suggests, and a reminder that every row in this table is a ceiling, not a guarantee.
This is the whole trick behind most “AI personalization” case studies you’ll read this year: pick the channel that grew fastest, don’t specify it’s a channel, and let the reader assume “revenue” means the whole company. It’s rarely dishonest in a legal sense. It’s just optimized for the reader not asking the CFO’s question.
The boring number nobody screenshots
The clearest counter-example I found is UK furniture retailer DFS, also a Bloomreach customer, whose case study is unusual because it discloses a real control group: an automated Bloomreach welcome-email series compared against a standard control that received no personalization. controlled The result: a 4.2% lift in conversion rate and a 3.9% increase in revenue, attributable specifically to that welcome series, versus the no-personalization control.
Nobody is putting “3.9%” in a headline. It doesn’t sound like a “future classic” case study. But it’s the single most trustworthy number in this entire piece, because it’s the only one measured against a group that didn’t get the treatment — which is the actual definition of measuring impact, as opposed to measuring a trend that might have happened anyway.
I want to hold this number to the same standard I’m applying to GANNI’s, though. Bloomreach’s DFS page doesn’t publish a sample size, a test duration, or a confidence interval — so “3.9%, controlled” is more rigorous than “60%, no methodology,” but it’s not the same thing as a peer-reviewed, statistically-significant result. A welcome-series test run on a small list for two weeks could produce a 3.9% swing from noise alone. Having a control group rules out one source of error (attribution to the wrong cause); it doesn’t automatically rule out a small or unrepresentative sample. I’m treating this figure as the best-available evidence in this space, not as a number with a published p-value, because it isn’t one.
If a personalization case study doesn’t tell you what the control group looked like, treat the headline number as a ceiling, not an expectation. In my experience advising on these rollouts, teams that budget for a DFS-sized outcome (mid-single-digit lift, compounding over a year or two) end up pleasantly surprised. Teams that budget for a GANNI-headline-sized outcome end up explaining a miss to their CFO in Q3.
How the vendor number stacks up against independent research
Pulling back from any single case study, the published research on personalization’s revenue impact has been fairly consistent for years, and it clusters well below the 40–70% range that case-study pages favor.
The NVIDIA figure deserves its own caveat: “89% say it’s lifting revenue” is a survey response, not an audited outcome — it tells you retail executives believe AI is helping, which is a real and useful data point about sentiment and adoption, but it is not the same category of claim as DFS’s controlled 3.9%. I’m including it because sentiment data matters for a different question (is the market moving this direction at all), not because it belongs in the same bucket as the revenue-lift figures above it.
The McKinsey and BCG figures need the same scrutiny I’ve applied to Bloomreach and GANNI, not a softer version of it. McKinsey’s “next best experience” article, the source of the 5–8% figure, describes it as drawn from the firm’s client engagements — “through our work with leading companies” — without publishing a sample size, a control methodology, or which companies were included. The older 5–15% figure has the same shape: a consulting-firm synthesis of client work, not a disclosed, replicable experiment. That doesn’t make the numbers wrong — McKinsey has visibility into far more implementations than any single case study does, which is a real advantage — but “aggregated across our consulting engagements” is its own confidence tier, closer to the vendor-claim end of the spectrum than to DFS’s controlled test, even though it comes from a source with no product to sell. Read the 5–8% and 5–15% figures above as credible industry synthesis, not as controlled experiments — better-sourced than a single vendor’s homepage stat, but not in the same evidentiary class as DFS’s holdout test.
What actually changed operationally at GANNI
The detail I find more useful than any percentage is buried in Bloomreach’s own RFP page: before switching, GANNI’s marketing team depended on an outside agency because campaign logic lived in custom SQL queries. After switching, the brand reportedly built and launched personalized campaigns without that dependency.
That’s a workflow change, not a model change — and it’s the most actionable finding in this entire article, more useful than any percentage above it.
Shipping speed compounds faster than model quality
Recommendation algorithms and send-time optimization get the credit in the marketing copy, but “our own team can now ship a campaign in a day instead of routing it through an agency queue” is, in my experience, usually worth more than any single algorithmic improvement, because it compounds. A team that can test twice a week outperforms a team that can test twice a quarter, even holding the underlying model quality constant: twice the iteration speed means roughly twice the learning rate on what actually moves revenue for your specific customers, quarter over quarter, independent of which vendor’s recommendation engine sits underneath.
If you take one diagnostic question out of this article for your own vendor evaluation, make it this one, not “what’s your AI accuracy”: who has to be in the room for my team to launch a personalized campaign, and how long does that take today? If the answer involves an agency, an engineer, or a ticket queue, that’s very likely a bigger lever than the model swap itself.
When this doesn’t pay off
Every one of the public case studies I could find sits in a specific niche: mid-to-large fashion, beauty, or DTC retail brands with meaningful email lists and enough SKU variety for recommendations to matter. The pattern doesn’t obviously transfer to:
- Low-SKU-count retailers. Recommendation engines need variety to work with. A brand selling a dozen core products has little for a model to differentiate between.
- Low-traffic sites. Personalization models need behavioral data to personalize against. Below a certain traffic threshold, you’re mostly serving cold-start defaults, not personalized experiences.
- Regions with stricter consent requirements. Under the EU’s GDPR and ePrivacy rules, granular behavioral tracking for personalization generally needs explicit, specific consent — and GANNI itself, as a Danish, EU-headquartered brand, operates under exactly that regime. US-based retailers targeting EU customers, or vice versa, should expect their addressable personalization surface (and therefore their achievable lift) to be smaller in the EU than in less consent-restricted markets, simply because less data is legally available to personalize against.
- Anyone who can’t tolerate a multi-quarter ramp. Even GANNI’s own timeline shows the smaller, more specific number (70% email revenue) reported over a full year, not the 90-day headline figure. Immediate 90-day wins tend to be the exception the marketing page picked, not the median outcome.
What to actually ask before you buy the story
If you’re evaluating a personalization platform and someone hands you a case study with a big number in the headline, these are the questions that separate a DFS-grade claim from a marketing-page claim:
- Is this total company revenue, or one channel’s revenue?
- Was there a control or holdout group, or is this before/after with no counterfactual?
- Is there a named person and title attached to the quote, or is it unattributed copy on a vendor’s own site?
- What was excluded — did seasonality, a product launch, or a paid-media increase happen in the same window?
- Over what timeframe, and is that the timeframe used in the headline, or a longer one buried in the body copy?
None of those questions are hostile to the vendor. Bloomreach’s own DFS case study answers all five, which is exactly why it’s the number I trust most in this article, headline size notwithstanding.
Frequently asked questions
Did GANNI really increase revenue 40% with AI personalization in 90 days?
Not quite as commonly repeated. The closest documented figure is a vendor-published claim of +60% revenue in the first three months post-migration, with no disclosed methodology. The better-sourced figure — a named executive, a specific scope — is +70% email-channel revenue over a full year, which is a different and more limited claim.
What’s a realistic revenue lift to expect from AI personalization?
Independent research (McKinsey, BCG) puts the typical range at roughly 5–15% for total revenue, with the more conservative, more recent McKinsey figure at 5–8%. The one controlled case study in this piece, DFS, landed at 3.9% for the specific campaign tested. Treat anything well above 15% as a channel-specific or vendor-reported figure until proven otherwise.
Why do case studies report such different numbers for similar technology?
Mostly definitional: “revenue” can mean total company revenue, platform-attributed revenue, or a single channel’s revenue, and case studies rarely specify which. Selection bias matters too — companies publish case studies when a metric spikes, not when it’s mediocre, so the public sample skews toward best-case outcomes.
Is GANNI a good comparison for my (smaller/larger) retail business?
Loosely, if you’re a mid-market retailer (roughly the same employee-count range, low hundreds to low thousands) with a meaningful CRM/email channel and enough product variety for recommendations to differentiate. If you’re pre-revenue, single-digit-SKU, or have very low site traffic, none of the public case studies in this space closely resemble your situation.
Does the EU’s GDPR limit how much personalization lift is achievable?
It limits the data you can legally use without specific consent, which in turn limits how granular your personalization can get. It doesn’t make personalization ROI impossible — GANNI itself operates under GDPR — but EU-facing programs should expect a narrower addressable dataset than a comparable US-only program.
What should I ask a vendor before trusting their case study number?
Whether the figure is total revenue or one channel, whether there was a control group, whether a named person stands behind the quote, what else changed in that window, and what timeframe the number actually covers versus the timeframe in the headline.
Is the “channel-to-total ladder” table in this article GANNI’s actual numbers?
No — it’s explicitly a modeled, illustrative sensitivity table using assumed channel-revenue shares, built to show how a 70% channel lift and a single-digit total-revenue lift can both be true simultaneously. GANNI’s actual channel mix isn’t public.
Related reading on this site: More case studies in AI transformation AI product recommendations Customer retention with AI Run your own numbers: Personalization ROI Calculator Personalization Maturity Assessment
If a personalization case study won’t tell you whether its “revenue” number includes a control group, assume it doesn’t — and budget accordingly.
Sources cited
- IMPACT Commerce — “Scaling GANNI’s CRM with Bloomreach” (Anders Riise Koch quote, +70% email revenue, +53% sessions)
- Bloomreach — RFP/RFI invitation page (return-buyer rate 11%→25%; agency/SQL dependency detail)
- Bloomreach — Bloomreach vs. Salesforce Marketing Cloud comparison page (+60% revenue, first 3 months, GANNI)
- Bloomreach — DFS case study page (+3.9% revenue, +4.2% conversion, controlled test; sample size and statistical significance not disclosed)
- McKinsey — “Next best experience: How AI can power every customer interaction,” Growth, Marketing & Sales Practice (5–8% revenue increase; methodology described only as “through our work with leading companies,” no sample size or control group disclosed)
- Retail Dive — sponsored content citing a 2019 McKinsey personalization study (5–15% revenue increase range; underlying McKinsey methodology not published in this source)
- BCG Personalization Index, as cited by Growth Engines (≈10-point CAGR gap, personalization leaders vs. laggards)
- NVIDIA — January 2026 State of AI in Retail and CPG survey, as reported by DestiLabs (89% self-reported revenue lift)
- Company-size estimates: Owler, Tracxn, RocketReach company profiles for Ganni A/S (revenue and employee-count ranges)